NetApp SolidFire Collector with Grafana 11
You may have heard Grafana 11 is coming out soon.
I decided to check if my old SolidFire Collector can work with it. Short answer: it does.
A longer answer is below.
I could have used the stand-alone Docker version, but I also wanted to make sure the Kubernetes recipe was still valid.
First I got the Kubernetes YAML for Collector v0.7 from here.
Split that in two YAML files as in Appendix A: one Graphite and another SolidFire Collector.
Create a new Kubernetes namespace such as sfc, and then deploy the two YAML files. Graphite should use a recent version, which is relevant to Grafana. SolidFire must have the right Graphite target (graphite, if it's in the same namespace).
Check pod logs to make sure both are working.
graphite-statsd does some preparations and then it settles like this:
Running migrations:
  Applying account.0001_initial... OK
  Applying account.0002_auto_20240423_1019... OK
  Applying admin.0001_initial... OK
  Applying admin.0002_logentry_remove_auto_add... OK
  Applying admin.0003_logentry_add_action_flag_choices... OK
  Applying dashboard.0001_initial... OK
  Applying events.0001_initial... OK
  Applying events.0002_auto_20240423_1019... OK
  Applying sessions.0001_initial... OK
  Applying tagging.0001_initial... OK
  Applying tagging.0002_on_delete... OK
  Applying tagging.0003_adapt_max_tag_length... OK
  Applying tags.0001_initial... OK
  Applying url_shortener.0001_initial... OK
ok: run: nginx: (pid 68) 3s
SolidFire collector:
2024-04-23 11:03:18,000 https://192.168.1.30:443 "POST /json-rpc/11.0 HTTP/1.1" 200 None
2024-04-23 11:03:18,012 - solidfire.Element - INFO - {"method": "ListISCSISessions", "id": 3899, "params": {}}
2024-04-23 11:03:18,012 {"method": "ListISCSISessions", "id": 3899, "params": {}}
2024-04-23 11:03:18,014 Starting new HTTPS connection (1): 192.168.1.30:443
2024-04-23 11:03:18,053 https://192.168.1.30:443 "POST /json-rpc/11.0 HTTP/1.1" 200 None
Then deploy Grafana 11 Preview, in the same namespace or elsewhere on the network (but if you deploy it elsewhere, you must make sure your Graphite service is reachable). I used grafana/grafana-oss:11.0.0-preview-ubuntu, although there's a lighter Alpine-based version.
I deployed Grafana in the same namespace, so that I don't have to fool around with networking.
Relevant images after everything was done:
$ docker images
REPOSITORY                                TAG                     IMAGE ID       CREATED         SIZE
grafana/grafana-oss                       11.0.0-preview-ubuntu   e935fc4be353   2 weeks ago     510MB
graphiteapp/graphite-statsd               latest                  f358fa45fd82   9 months ago    851MB
scaleoutsean/sfc                          v0.7                    b0e580d6788e   24 months ago   141MB
From that point on, it's very easy.
In Grafana, add a Graphite data source. There's no authentication setup in the recipe, so http://graphite:80 in the same namespace was enough. I made it my default data source, but it doesn't have to be.
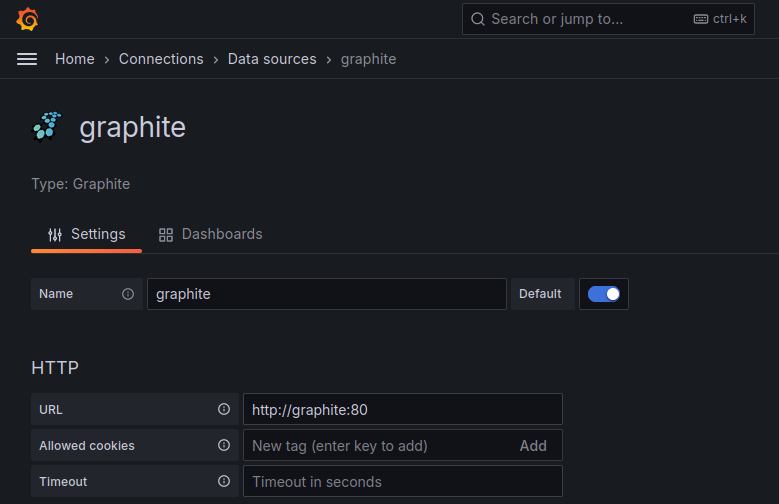
You can't see it in this screenshot, but there's a drop-down menu where you pick your Graphite version. 1.1.x is the default and so you don't have to do anything if you have a recent version.
After that I crated a new dashboard and panel and picked Graphite as my data source.
The only thing to remember is to set the initial query to a shorter value such as 5 minutes, otherwise you'll see a lot of nothing in the default 6 hour query as you've just fired up these services.

Now you just pick a path such as netapp.solidfire.cluster and find a metric to visualize. My cluster is PROD and I queried compression_factor.
Conclusion
SolidFire Collector v0.7 still works fine with latest Graphite 1.11 and Grafana 11.
(Update (2024/06/13): SFC v2 was posted yesterday and HCI Collector v0.7 can now be downloaded from here. Current master branch is the new SFC v2 about which you can read in the repository's README or a blog post here.)
Generally I'd recommend SolidFire Exporter (for Prometheus) as an easier metrics collector, but in the case you want to use SolidFire Collector, it's still good and easy to customize.
Appendix A - YAML files
- Graphite v1.1.10-5 (packaged in graphite-statsd) deployment and service:
apiVersion: apps/v1
kind: Deployment
metadata:
 labels:
   app: graphite
 name: graphite
spec:
 replicas: 1
 selector:
   matchLabels:
     app: graphite
 template:
   metadata:
     labels:
       app: graphite
   spec:
     containers:
     # https://hub.docker.com/r/graphiteapp/graphite-statsd/tags
     - image: graphiteapp/graphite-statsd:master
       name: graphite
       ports:
       - containerPort: 2003
         name: carbon-plain
       - containerPort: 2004
         name: carbon-pkl
       - containerPort: 2023
         name: carbon-ag-plain
       - containerPort: 2024
         name: carbon-ag-pkl
       - containerPort: 8125
         name: statsd
       - containerPort: 8126
         name: statsd-admin
       - containerPort: 80
         name: http
---
apiVersion: v1
kind: Service
metadata:
 name: graphite
 labels:
   app: graphite
spec:
 type: LoadBalancer
 ports:
 - port: 80
   protocol: TCP
   targetPort: 80
   name: http
 - port: 2003
   protocol: TCP
   targetPort: 2003
   name: carbon
 selector:
   app: graphite
- SolidFire Collector (don't forget to change MVIP, admin's username and password):
apiVersion: apps/v1
kind: Deployment
metadata:
 labels:
   app: collector
 name: collector
spec:
 replicas: 1
 selector:
   matchLabels:
     app: collector
 template:
   metadata:
     labels:
       app: collector
   spec:
     containers:
     - image: docker.io/scaleoutsean/sfc:v0.7
       name: collector
       args: [ "-s", "$(SF_MVIP)", "-u", "$(SF_RO_ADMIN)", "-p", "$(SF_RO_ADMIN_PASS)", "-g", "$(GRAPHITE_TARGET)" ]
       env:
         - name: SF_MVIP
           value: "192.168.1.30"
         - name: SF_RO_ADMIN
           value: "monitor"
         - name: SF_RO_ADMIN_PASS
           value: "*************"
         - name: GRAPHITE_TARGET
           value: "graphite"