Get NetApp Hybrid Cloud Control logs via the HCC API
Hybrid Cloud Control (HCC) is a group of services - management plane, if you will - for out-of-band management of NetApp HCI, SolidFire and eSDS. Currently it's a bunch of containers that runs in a VM commonly called mNode (short for Management Node).
NOTICE: all credentials and tokens on this page are samples, not leaked.
As noted in last week's post on HCC and mNode log forwarding (you may want to read it if you want additional context), right now we can't forward Docker container logs to external destination (not in a supported way). We need to use the HCC API to get container logs of interest.
GET /logs
After everything else has failed, we have to read the manual. Relevant section of the HCC API, in the case you haven't looked:
    "/logs": {
      "get": {
        "description": "The logs endpoint is used to get logs from the services.",
        "operationId": "routes.v1.log_api.get_logs",
        "parameters": [
          {
            "description": "Number of lines to retrieve from the logs.",
            "in": "query",
            "name": "lines",
            "schema": {
              "default": 1000,
              "type": "integer"
            }
          },
          {
            "description": "Name of the service",
            "in": "query",
            "name": "service-name",
            "schema": {
              "default": "",
              "type": "string"
            }
          },
          {
            "description": "Type of logs to retrieve",
            "in": "query",
            "name": "type",
            "schema": {
              "default": "service",
              "enum": [
                "syslog",
                "service",
                "all"
              ],
              "type": "string"
            }
          },
          {
            "description": "ISO-8601 timestamp for the service logs starting point. Example: '2019-04-01T18:34:36Z'.",
            "in": "query",
            "name": "since",
            "schema": {
              "format": "date-time",
              "type": "string"
            }
          },
          {
            "description": "Get archived logs",
            "in": "query",
            "name": "archived",
            "schema": {
              "type": "boolean"
            }
          },
          {
            "description": "ISO-8601 timestamp for the service logs ending point. Example: '2019-04-01T18:34:36Z'.",
            "in": "query",
            "name": "until",
            "schema": {
              "format": "date-time",
              "type": "string"
            }
          }
        ],
        "responses": {
          "200": {
            "description": "OK"
          },
          "400": {
            "description": "Bad Request"
          },
          "401": {
            "description": "Unauthorized"
          },
          "404": {
            "description": "Not Found"
          }
        },
        "security": [
          {
            "elementOAuth": [
              "mnode_api:r"
            ]
          }
        ],
        "summary": "Get logs from the MNODE service(s)",
        "tags": [
          "logs"
        ],
        "x-operationAlias": "getLogs"
      }
Considering a shortage of useful examples and so on, let's try to figure out some key elements required to GET \logs.
service-name parameter
This isn't really a service name (api-gateway, for example) but a container name. You can find a list of service names and what they do in this KB (NetApp support login required).
So this works: https://192.168.1.31/mnode/1/logs?lines=1000&service-name=mnode_package-svc&type=service (assuming you provide a valid bearer token.)
How to get the current service names? You can get a list of running container ID's and names like this:
$ sudo docker ps -a --filter "name=mnode_" --format "{{.ID}}: {{.Names}}"
5e69af253a54: mnode_api-gateway.1.gking7pxr280mpd97d1ho2z85
c03dd36c2f12: mnode_hcc-ui.1.xsjwurknk41fvz4mwuec9844b
f14f10d6aefc: mnode_credential-svc.1.mb6hurx981ux2uetw2kb6wpn8
594e68dd176a: mnode_vcp-sioc.1.nlfew38hf0mutxireo0j6krpy
40b265534b5b: mnode_mongo.1.b6n0ip292qecd5idbcrwtwecp
b477504551ab: mnode_simple-data.1.19kjp226v2g3mp9y9410kyylj
42d366150c41: mnode_logs-svc.1.nxk8szxmjuuiyo30frxdltcel
f3ae48980a8e: mnode_hci-monitor.1.q42vviwgeqqaj23t3y3dh8ooi
8370e40d5ce0: mnode_mnode.1.rkmcgus7u8jzck3z6n69okabc
a9779bacaed1: mnode_mnode-svc-mon-grafana.1.p73z9grq4tbz84t4d8rdr2x96
51aaf81afce8: mnode_package-svc.1.n7e5ndta6akh1t9hqfllvfnok
92389db81077: mnode_hardware-svc.1.yzyw30yvsba4ywd7p2xeucq4x
bd4c6c272e6c: mnode_vcenter-v2-svc.1.wje41fmyhqtl6f25buwtfg6u3
f2a797aec34b: mnode_telemetry-service.1.tilwniy8w8nkhjhvgl7g6nz39
3bc90001c4de: mnode_api-gateway.1.xi5u8115tgw5y7j0pit3x2tn6
a6be445b120f: mnode_storage.1.v8017p8fsaofak8qn55g4thzq
e6b29160dd47: mnode_authz.1.9osgex2wakazo45t2bn9ccehv
35fccce185ab: mnode_inventory-service.1.1ykva88x9ygxk17ps8osvj3sc
f51e30b65600: mnode_mnode-svc-mon-prometheus.1.3uepjf4y6phfqbddvqzqn48pt
47662ca5154c: mnode_docker-proxy.1.rojuy25wqsixi1por12bvbg4d
517988746c82: mnode_mnode-svc-task-monitor.1.spjfcfo9p7cw20xdon8ddctd1
279299b1b47c: mnode_k8sdeployer.1.u6ley1mwon00082gv043epvmp
4b3463ade720: mnode_mnode-svc-aiq-collector.1.phxf6mixikog3n8shdofs9rvu
5e867cd32344: mnode_api-gateway.1.vve7oqygsxxdyz9t2jzo3xkm8
44f1d9e0510e: mnode_package-svc.1.4bg9t4ixe9qcczhkj3gdyb1ns
3a131d10f24a: mnode_mnode-svc-task-monitor.1.t7eaenozg7f85ycf6p7q34hrs
0a774564d471: mnode_inventory-service.1.rxsoxf1ymab2joqzcswe4po84
47aa11911914: mnode_mnode.1.ntp7ygkt9jyd1wwb0w9tuo2sw
31871c6bf038: mnode_hardware-svc.1.2wzgnufu44qqinoy7qd9skcbj
I was surprised to discover that filtering for exited=0 didn't filter out exited containers (docker ps --filter 'status=running' shows only running containers, so there's that.)
If your mNode is called mnode then "service" names would be mNode_$SERVICE_NAME where $SERVICE_NAME is a list of (actual) service names you care about. Once you have mNode name and that list, you can get loop through it and get Container IDs which can be use to get the logs.
You want to loop through the list because otherwise you get all the container logs at the same time, which seems like a bad idea to me.
What to do about the logs of exited containers? We could get those as well, or we could watch Docker service and write a handler for those situations (for example, fetch and forward their log, and then remove the exited container so that we don't have to deal with exited containers.)
type parameter
If you plan to use rsyslog to forward system logs, then here you'd only specify service logs.
since parameter
The good news is this works the same as --since in Docker, so everyone gets it.
$ sudo docker logs --since 10m 5e69af253a54
10.0.0.23 - - [08/Dec/2020:04:29:59 +0000] "GET /metrics HTTP/1.1" 200 2412 "-" "Prometheus/2.17.1"
10.0.0.23 - - [08/Dec/2020:04:30:09 +0000] "GET /metrics HTTP/1.1" 200 2412 "-" "Prometheus/2.17.1"
10.0.0.23 - - [08/Dec/2020:04:31:59 +0000] "GET /metrics HTTP/1.1" 200 2412 "-" "Prometheus/2.17.1"
[pid: 563|app: 0|req: 2028/5510] 127.0.0.1 () {34 vars in 1272 bytes} [Tue Dec  8 04:32:01 2020] GET /access => generated 0 bytes in 9 msecs (HTTP/1.1 204) 1 headers in 59 bytes (0 switches on core 0)
GW-PROXY: 10.0.0.23 - - [08/Dec/2020:04:32:01 +0000] "GET /about HTTP/1.1" 200 72 "-" "python-requests/2.23.0" "-" rid="6d86b2d6e18c69ae442e0c6b91568310" urt="-"
We can run our collector every 5 minutes and collect logs for the previous 6 minutes.
The bad news is the API won't do this for us: we have to get the current UTC time in the ISO-8601 format, deduct our --since value (10 minutes) and use that cut-off value in our API call. You could get all the available logs every time, but if you poll periodically for monitoring or compliance, you probably don't want to do that.
archived parameter
If mNode or vSphere suffers unplanned (i.e. there are logs that we may have missed to fetch) downtime, we can manually write a script with archived=true and with a since value that reflects time since last downtime minus our gathering interval (for example, 5 minutes).
Next steps
Now that we know what we're after, we could first write a log-polling script and later take a look at how to handle edge cases such as unplanned downtime.
The annoying part is dealing with authorization and refreshing the bearer token, so I'm still looking at other ways (in addition to what was discussed in the HCC and mNode log forwarding post.)
Alternatives to using the API:
- Run Docker logs commands remotely (from a dedicated VM with Filebeat, for example)
- Run Docker shell commands locally (in mNode VM, mentioned last week) and send the logs to external destination
Both of these approaches eliminate the need to work with the HCC API as you can simply use Docker commands and pipe output to an external destination, and they can be more reliable given the same amount spent on coding a script to gather them. But I'm not sure if running own programs on mNode would be supported (I suspect yes because these approaches don't install any containers and don't use significant resources.)
Example with Docker logs command executed remotely
mNode's Docker doesn't listen on network. But with docker context create (on our client) we can get to the container logs remotely. First we set up password-less SSH to mNode (192.168.1.31) and then create a Docker context. Then on mNode we add the administrator user to Docker group (sudo usermod -aG docker admin). With that we can run the same command that we used locally, on our client, to get the last 10 minutes of a container's logs.
$ # mNode = 192.168.1.31
$ # ssh admin@192.168.1.31 -i ~/.ssh/id_rsa.pub # passwordless SSH to mNode from external client should work
$ docker context create mnode --docker "host=ssh://admin@192.168.1.31:22"
$ docker -H ssh://admin@192.168.1.31 logs --since 10m 5e69af253a54
Obtaining mNode Bearer Token with curl, Python and PowerShell
As we access Swagger we have to authenticate to obtain authorization in this modal:
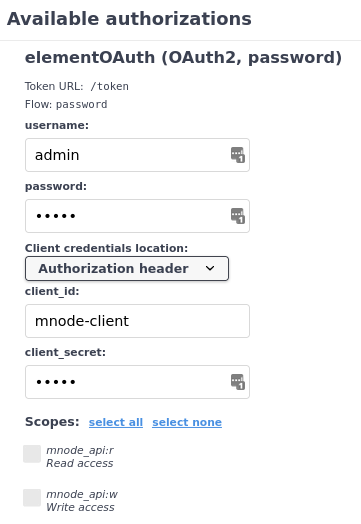
It's confusing what exactly needs to be entered here, but for what it's worth it's documented here.
Token URL: /token
Flow: password
username: admin                    # SolidFire cluster admin account
password: ******                   # Password for SF cluster admin account
Client credentials location: basic # meaning: Authorization header
client_id: ******                  # currently fixed to: mnode-client
client_secret: ******              # leave empty
The URL isn't clearly documented as well (but there's that /token in the modal above) so we can at least make educated guesses.
Request to get bearer token from mNode 2.16 (latest as of now) located at 192.168.1.31, with SolidFire cluster administrator credentials "admin:admin".
$ curl --location --request POST 'https://192.168.1.31/token' \
--form 'client_id="mnode-client"' \
--form 'username="admin"' \
--form 'password="admin"' \
--form 'grant_type="password"'
Response:
{
    "access_token": "eyJhbGciOiJSUzI1NiIsInR5cCI6IkpXVCJ9.eyJuYmYiOjE2MDc0MTAwMTEsImV4cCI6MTYwNzQxMDYxMSwiaXNzIjoiaHR0cHM6Ly8xOTIuMTY4LjEuMzEvYXV0aCIsImF1ZCI6WyJtbm9kZV9hcGkiLCJtbm9kZV91cGdyYWRlX29yY2hlc3RyYXRvciIsInRhc2tfbW9uaXRvciJdLCJjbGllbnRfaWQiOiJtbm9kZS1jbGllbnQiLCJzdWIiOiJhZG1pbiIsImF1dGhfdGltZSI6MTYwNzQxMDAxMSwiaWRwIjoibG9jYWwiLCJwcmVmZXJyZWRfdXNlcm5hbWUiOiJhZG1pbiIsImlhdCI6MTYwNzQxMDAxMSwianRpIjoiNlRwYlZwWDR1VmxtQWRyRW9TUXUtUSIsInNjb3BlIjpbIm1ub2RlX2FwaTpyIiwibW5vZGVfYXBpOnciLCJtbm9kZV91cGdyYWRlX29yY2hlc3RyYXRvcjpyIiwibW5vZGVfdXBncmFkZV9vcmNoZXN0cmF0b3I6dyIsInRtOmQiLCJ0bTpyIiwidG06dyJdLCJhbXIiOlsiQ2x1c3RlciJdLCJuZXRhcHBfYWNjZXNzIjpbImFkbWluaXN0cmF0b3IiXX0.6CeUa7-xjwW3RET0-Zt1uzgFNuEYQA5b5fH23YZhQpDY7yz3ADkMtdN_GM9HX17C0UNCGueIrDcv_zF3Hp0EkoTRwAvnROeD7_ejkH-EILEAithEC52d8v0QVJm59mxAvYCW3XCsf7q-jADqrDt-y6X4av0CDk8xwM_LUTuo9Eq_yUMPXjMJRKVECxuggCxFm8RM4dWmq1Hh1tpwt-oiytg-I1jTUbTDfwnmXhCtjoxxK7eWmfJfWoxXHyoR7zFw8lvdOkfTblcQiOuFacrgUabLkVhwimVTju2Dx8lcn0sNDdMS1SMKs9hP_MudXBIAweFbrwoj3hNgQsg05egw8A",
    "expires_in": 600,
    "token_type": "Bearer",
    "scope": "mnode_api:r mnode_api:w mnode_upgrade_orchestrator:r mnode_upgrade_orchestrator:w tm:d tm:r tm:w"
}
We can likely get away with only mnode_api:r and mnode_api:w (we won't be upgrading HCI firmware or anything like that), but the online (Swagger) API docs aren't very clear on that so let's just ignore this.
curl translated into Python 3:
import requests

url = "https://192.168.1.31/token"

payload={'client_id': 'mnode-client',
'username': 'admin',
'password': 'admin',
'grant_type': 'password'}
files=[

]
headers = {}

response = requests.request("POST", url, headers=headers, data=payload, files=files, verify=False)

print(response.text)
And into PowerShell:
$multipartContent = [System.Net.Http.MultipartFormDataContent]::new()
$stringHeader = [System.Net.Http.Headers.ContentDispositionHeaderValue]::new("form-data")
$stringHeader.Name = "client_id"
$StringContent = [System.Net.Http.StringContent]::new("mnode-client")
$StringContent.Headers.ContentDisposition = $stringHeader
$multipartContent.Add($stringContent)

$stringHeader = [System.Net.Http.Headers.ContentDispositionHeaderValue]::new("form-data")
$stringHeader.Name = "username"
$StringContent = [System.Net.Http.StringContent]::new("admin")
$StringContent.Headers.ContentDisposition = $stringHeader
$multipartContent.Add($stringContent)

$stringHeader = [System.Net.Http.Headers.ContentDispositionHeaderValue]::new("form-data")
$stringHeader.Name = "password"
$StringContent = [System.Net.Http.StringContent]::new("admin")
$StringContent.Headers.ContentDisposition = $stringHeader
$multipartContent.Add($stringContent)

$stringHeader = [System.Net.Http.Headers.ContentDispositionHeaderValue]::new("form-data")
$stringHeader.Name = "grant_type"
$StringContent = [System.Net.Http.StringContent]::new("password")
$StringContent.Headers.ContentDisposition = $stringHeader
$multipartContent.Add($stringContent)

$body = $multipartContent

$response = Invoke-RestMethod 'https://192.168.1.31/token' -Method 'POST' -Headers $headers -Body $body -SkipCertificateCheck:$True
$response | ConvertTo-Json
This is a longish script for what it does, but if that bothers you it should be easy to make it shorter based on online help pages and some searching. And it does work (PowerShell 7.1.0).
You need to refresh the token within expires_in seconds. Or not, if you fetch logs once every 30 minutes or longer, because you can get a new token every time.
With all parts and parameters clear and a valid bearer token, the rest is generic: we can create REST API requests to get the log for each service. An example for "service" (container) mnode_api-gateway, since Dec 8, 2020 00:00:00 UTC time:
$ curl -k -X GET \
"https://192.168.1.31/mnode/1/logs?service-name=mnode_api-gateway&type=service&since=2020-12-08T00%3A00%3A00Z" \
-H  "accept: */*" \
-H  "Authorization: Bearer eyJhbGciOiJSUzI....8a"
Getting logs with Python or PowerShell
Now that we got a valid token we just need to pass it in headers like so:
import requests

# Loop over a list of HCC services to get the log each
# Assemble a per-service URL where service string is something like mnode_api-gateway
# service_url = url_base + time_since + service_string + service + ending
# example of service_url:
# https://192.168.1.31/mnode/logs?since=2020-12-08T00%3A00%3A00Z&service-name=mnode_api-gateway&stopped=false

headers = {
    'Authorization' : ('Bearer ' + token),
    'accept' : '*/*',
    }
result = requests.get(service_url, headers=headers, verify=False)
PowerShell would work exactly the same: loop over a list of services, create custom URLs and hit each per-service URL with that token in request headers.
If everything works out you can save the response to a file. You can strip the first three rows if you don't want them (hard line breaks below were inserted by me for better readability), but it doesn't hurt to leave them as-is, especially if the logs must not be tampered with.
>>> result.text
'\n=========================================================
\n    mnode_api-gateway.1.gking7pxr280mpd97d1ho2z85
\n=========================================================
\n10.0.0.23 - - [08/Dec/2020:11:34:09 +0000] "GET /metrics HTTP/1.1" 200 2476 "-" ...
'
Simple demo using this approach can be viewed here (length: 1m45s). What's "missing" is log forwarding (which is usually required) which something I explained in the previous post about mNode/HCC log forwarding.