Brute force sizing NetApp E-Series
- Introduction
- Considerations
- Create configuration options
- Choice of query tool
- Show available options
- Query capacity range
- Manual selection of promising candidates
- Discuss and configure
- Where's the metadata, Kenneth
- What about the performance
- Why not use MS Excel
- Alternative approach: Web page with sort and filter features
- Conclusion
NOTE: the Web site with this tool was improved and updated on 2024/04/19, so some details below may differ from current functionality
Introduction
Some time ago I wrote a demo of a "Brute Force Sizer for SolidFire" which I really liked because it saved me a lot of time compared to the official company tool.
This week I decided to do something similar for E-Series when configured for BeeGFS.
It took me hours, but sizing with the official E-Series sizing tools also takes hours (if you do it 10 times) and it happens almost every week.
This is simple to replicate on your own: you can find the supported RAID configurations, disk sizes and enclosure counts from E-Series data sheets - there's no secret sauce of any kind:
- Data sheet for EF600 (including EF600 Hybrid) shows up to 420 NL-SAS HDDs (in addition to 2U controller shelf with 24 2.5" NVMe SSDs)
- Product page for E5760 shows up to 480 NL-SAS HDDs if 60-disk controller shelf is used
A sortable and searchable HTML table that does many things that I do in Jupyter can be found here (click on BeeGFS tab).
Considerations
Configuring NetApp E-Series has more options compared to SolidFire, so a brute force sizer must eliminate some combinations. On the other hand, BeeGFS shouldn't be attached to E-Series with just any configuration, which helps.
Here's what I focused on:
- Proper RAID 6 (8D2P) for Data, with several other options for EF600 where up to 24 disks can be used in controller shelf
- Some DDP configurations that result in 5, 4, 2 and 1 DDP per 60-drive enclosure
- Small RAID 1 / RAID 10 groups on EF600 useful for Metadata
Five DDP (each with 12 disks and 2 disks of spare capacity) per enclosure is weird, but DDP starts at 11 disks which is even weirder.
For NL-SAS disk sizes, I only used 10TB and larger and didn't bother with smaller disks because they use a lot of power and rack units (which is okay when you need under 200-300 TB of capacity but in the case of BeeGFS almost no one does).
I also didn't bother with:
- E5700 with 2U controller shelf (E5724). E5700 is usually used for density (E5760 comes with a 60-disk controller shelf), and secondly, if I wanted to use E5724 I could simply look at EF600 Hybrid configurations which is how E5724 configurations would look like
- 1.92TB SSD disks for EF600 - too insignificant for most cases. As soon as we hit 1PiB usable BeeGFS capacity, 2% Metadata capacity would require we max out a controller shelf of EF300 or EF600 (24 * 1.92 TB * 0.5 (R1)) which isn't worth it
Create configuration options
With these configuration "principles" in place, I wrote a bunch of "for each" loops with if-then's to generate the various permutations.
ComboID,Model,Enclosure,Protection,DiskCount,DiskSize,RawTB,UsableTB,UsableTiB,BeeGFSTiB
0,E5760,1,R6,10,10,100,80,72.8,71.3
1,E5760,1,R6,10,12,120,96,87.3,85.6
2,E5760,1,R6,10,18,180,144,131,128.3
3,E5760,1,R6,20,10,200,160,145.5,142.6
4,E5760,1,R6,20,12,240,192,174.6,171.1
5,E5760,1,R6,20,18,360,288,261.9,256.7
6,E5760,1,R6,30,10,300,240,218.3,213.9
7,E5760,1,R6,30,12,360,288,261.9,256.7
...
483,EF600H,7,DDP,60,10,4200,4060,3692.5,3618.7
484,EF600H,7,DDP,60,12,5040,4872,4431.1,4342.4
485,EF600H,7,DDP,60,18,7560,7308,6646.6,6513.7
This initially resulted in 486 configuration combinations and a 21kB CSV file, but later I added more.
Some important points:
- ComboID is a unique ID for particular combination created by my config generator script, which helps when the other person isn't using Jupyter and just needs some inputs to create a price quote and such. I can paste that row or give them the CSV file and tell them "please create a quote for Combo IDs 5 and 6"
- BeeGFSTiB is the sum of TiB units for BeeGFS formatted Data disks
- (Quantity of) Enclosure(s) helps me watch rack space. Normally the fewer enclosures the better, but if you want to add disks within months you may want to use more enclosures than necessary so that disks can be added later on
Choice of query tool
My ideal query tool would be a single page app with Java Script tables that can sort, filters and enable/disable certain options.
In practice that turned out to be more complicated than necessary and I also realized I'd need friendly ways to export table data as text, and more.
I did something like that for SolidFire Capacity and Efficiency Report Generator, but remembering the hassle, I went back to Jupyter.
Show available options
This scatter chart isn't actionable and doesn't have a legend, but I wanted to see how all of capacity options look like:

Key points:
- The blue and green dots are capacity values based on E5760 (blue) and EF600 Hybrid arrays. These can go up to several PiB, but E5760 can be configured with more capacity because it can use eight 60-drive expansion shelves vs. seven for EF600 Hybrid. Of course, I had known that before I saw the chart, but it's nice to see that configuration options for larger capacities become scarce once you get to 3-4PiB range. This also means when querying for sub-3PiB ranges, we should use a narrow Min-Max range, while for larger capacity we can use a wider range, in order to get several - but not too many - solutions that satisfy these criteria
- The red dots are EF600-based combinations (single all-flash NVMe controller shelf) - usually used for metadata, so still relevant. Personally I usually size for BeeGFS Data capacity first, and for Metadata after that (and possibly using a dedicated EF600 unit)
What's the difference between EF600 and EF600 Hybrid? The latter is really just the EF600 with SAS expansion enclosures which can accommodate NL-SAS HDD and SAS SSD drives. There are other, subtler differences, as well.
Below is a bar chart of by BeeGFSTiB of different Combo IDs. It can be sorted by BeeGFSTiB (ascending) and have ComboIDs displayed on the side but it'd take a larger image to do that.

Query capacity range
Currently I have just one query type, which is for a capacity range of BeeGFS data (in TiB). As an example, I entered 2400 and 2600 (TiB).
Results of that query can be plotted as bar chart, with the length of blue bars representing usable BeeGFS Data capacity in TiB (again, I don't have ComboIDs shown, but it's hard for IDs that are next to each other - I suppose should create another data set from the results and plot that).

That aside, this chart gives us some useful hints.
- At the very bottom, at least two combinations barely make it. We definitively need to check out those
- Many combinations overshoot minimum usable BeeGFS Data capacity by a lot, so I could have used a smaller range (e.g. 2400-2500) to get fewer choices
That chart is basic, but can be improved. An improved example:
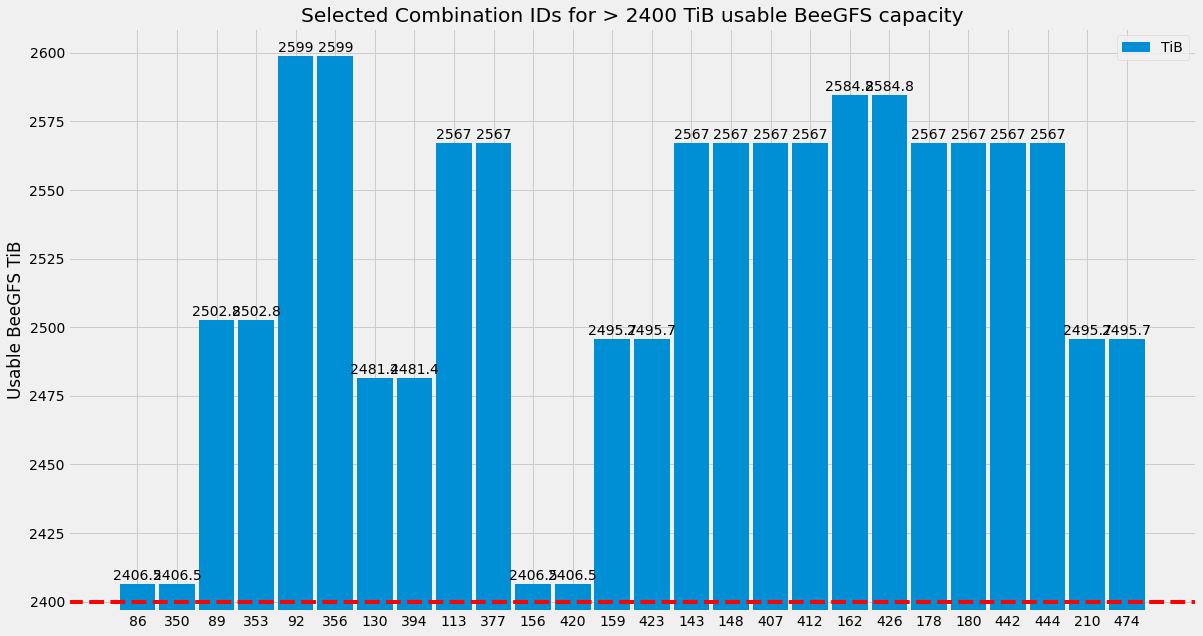
Anyway, it's time to inspect these configurations to identify best candidates.
Manual selection of promising candidates
After drawing that chart I also print out the result in text format, to be able to reason about it.
Resulting combinations are sorted by Enclosure count and Data capacity, because these are usually most important properties when evaluating a combination. We can ignore combinations with high enclosure count and Data capacity far beyond 2400 TiB:
  ComboID  Model      Enclosure  Protection      DiskCount    DiskSize    BeeGFSTiB
---------  -------  -----------  ------------  -----------  ----------  -----------
       86  E5760              3  DDP                    12          18       2406.5
      350  EF600H             3  DDP                    12          18       2406.5
       89  E5760              3  DDP                    15          18       2502.8
      353  EF600H             3  DDP                    15          18       2502.8
       92  E5760              3  DDP                    20          18       2599
      356  EF600H             3  DDP                    20          18       2599
      130  E5760              4  DDP                    60          12       2481.4
      394  EF600H             4  DDP                    60          12       2481.4
      113  E5760              4  R6                     50          18       2567
      377  EF600H             4  R6                     50          18       2567
      ...
Some of the DDP combinations have disk count ranging from 12 to 60. Are some enclosures with DDP pools half-populated? No. Where it says 12 disks, there's really five DDP groups of 12 disks for a total of 60. Where it says 60, there's one DDP (pool) with 60 disks. The latter has a lower overhead because both reserve two disks worth of spare capacity.
With RAID 6, this sizer works differently - if it says 50 disks (e.g. Combo ID 113), there's five RAID 6 volume groups with 10 disks each. But, why have a different approach?
It's a compromise, of course, but the idea is that when DDP is used, it is to fully populate an enclosure and lower the cost of capacity and performance. RAID 6 is more frequently used and the first choice for BeeGFS Data disks, and I would get much fewer choices if I only used fully populated enclosures.
For RAID 6, I need all the possibilities for one fixed disk group size, 8D2P. For DDP, I have a small number of differently sized DDP (from 12/2 to 60/2), which means allowing partially populated enclosures would mushroom the number of combinations in CSV file to thousands. Allowing a variety of DDP pool sizes would make that even worse.
Discussion:
- All top configurations - including the two that barely make it, are based on DDP. For sequential IO DDP is slower than RAID 6 (8D2P) but if I needed a cluster for non-sequential or mixed IO maybe I'd go with Combo ID 86. Notice that 3 enclosures x 60 disks = 180 disks.
- For highest performance, I'd go down the list until I find a RAID 6-based combination. Those are Combo IDs 113 and 377 which are essentially the same disk configurations with different controllers. I'd need more RU (space) compared to ID 86 - four enclosures (plus one 2U for EF600 Hybrid which has a 2U EF600 controller shelf can only hold NVMe SSDs but, as I mentioned at the top, I didn't want to complicate the tool to account for that). So I'd probably go with Combo ID 113 for this one.
- One of the reasons I didn't want to account for the extra 2U for EF600 Hybrid controller shelf in these combinations is what I said at the top - usually I use that EF600 controller shelf for Metadata so I need those 2Us for SSDs either here, or in a dedicated EF600 or EF300 2U controller dedicated to BeeGFS Metadata, for which I'd add 2U RU count later
Discuss and configure
People usually like to check top 2-3 options and discuss advantages and disadvantages, so we can first copy top candidates and share them via email.
  ComboID  Model      Enclosure  Protection      DiskCount    DiskSize    BeeGFSTiB
---------  -------  -----------  ------------  -----------  ----------  -----------
       86  E5760              3  DDP                    12          18       2406.5
      350  EF600H             3  DDP                    12          18       2406.5
      113  E5760              4  R6                     50          18       2567
      377  EF600H             4  R6                     50          18       2567
I know I just said "2-3", and here I came up with four.
I chose 4 options rather than "2-3" because this is really just two options with different arrays, and the third option is the choice of array - whether we want the E5760 or EF600 Hybrid.
If you have more conviction, or if the requirements are very specific, you can even choose the winning combination right away.
Where's the metadata, Kenneth
That's easy to size because Metadata capacity is just a fraction of Data capacity, and normally we pick RAID 1/10 so there isn't much to think about.
In fact, while writing this post this reminded me I can just take the min value from Data, multiply it by 0.02 and 0.04 to get min_md and max_md, respectively, and because I have several RAID 1 "combos" I may be able to do this right away. Took me several minutes to figure out why I couldn't get any RAID 1-like results.
I assumed needed at least 48 TiB for Metadata (2% of Data). UsableTiB, rather than usable BeeGFSTiB, are used in this query.
I hit a problem here: in all cases Usable TiB is less than my minimum metadata capacity requirement. I couldn't even see this chart because nothing matched - I had to show configurations less than 48 TiB to figure this out:

To fix this I generated few more RAID 1/RAID 10 combinations which resulted in additional 10 combinations in the CSV file, and reloaded from Jupyter.

In final version I allow both RAID 6 and RAID 1 types because it's trivial to skip RAID 6 combinations when we don't intend to use them:
  ComboID  Model    Protection      DiskCount    DiskSize    UsableTiB
---------  -------  ------------  -----------  ----------  -----------
      493  EF600    R6/DDP                 16           4         49.1
      488  EF600    R1                     14           8         49.1
      473  EF600    R1                      8          15         55.5
      499  EF600    R6/DDP                 18           4         55.5
      494  EF600    R1                     16           8         55.5
      477  EF600    R6/DDP                 10           8         55.5
We can either populate up to 24 slots of the EF600 Hybrid controller shelf I use for Data, or get an additional EF300 (2U) or EF600 (2U) array for Metadata.
We could use DDP (Combo ID 493), but there's no need for that - RAID 1 is much more suitable for Metadata and 14 7.68TB disks give us the IOPS we need to serve metadata for this 2.4PiB system.
When we need more performance (IOPS), we use more smaller disks (e.g. ComboID 488 or 499). If not, or if we plan to grow this cluster while using dedicated EF600 for Metadata, use fewer large disks (e.g. ComboID 473).
Sometimes we may get the minimum file count or MD IOPS requirement in which case we'd work by that, but that's trivial to add in output, and we'd still size for capacity first and then simply pick a RAID 1 configuration with a higher disk count to meet the metadata performance requirement.
What about the performance
Similar to the disk size thing I mentioned above, usually there's enough disks involved to hit the array maximum. If - while doing the above - I knew the requirement was 100GB/s sequential read, knowing how fast each array is I'd know I need (for example) four, so I'd pick a combo with four enclosures and make it four arrays with 1 (controller) enclosure each. That's usually easier to do than finding suitable number of disks and enclosures.
The other thing is given four alternatives, it's easy to tell which one is faster (for NL-SAS, it's usually the one with more disks and RAID 6), so if I need to meet specific performance target I'd pick one or two and verify performance sizing based on other tools available.
Why not use MS Excel
It's not an either-or question - the CSV file with configuration combinations can be imported to Excel and it's only a matter of querying it from within Excel. So that option is there.
The reason I chose to use Jupyter over Excel is that it's easy to use from a browser and locally, without waiting for the file to open and having to click more times than necessary. With Jupyter I just need to input two values (Min BeeGFS TiB, Max BeeGFS TiB) and click Run. The same Python code can run from the CLI, while which is another benefit for me or folks who can't/won't run Jupyter.
I also created a CLI version - it can work with CSV files on S3 (using S3 Select; the same way I did it for SolidFire), and because CLI output isn't easily sort-able, I sort the output several ways to be able to focus on my sizing priority (whether it's capacity, cost, performance…):

MS Excel is more feature-full and charting features are amazing, but the speed and flexibility to send plain text output via instant messaging or email made me go with Python. (In the case you prefer PowerShell, that would work just as well - Jupyter can use PowerShell as well, as long as you don't plan to create charts, which is harder than in Python).
One last point: when I get a spreadsheet-based sizer, it's not easy to review it. With a brute force approach, it's easy to go to Combo ID in the CSV file and see if it makes sense or not.
Alternative approach: Web page with sort and filter features
Here's a less powerful alternative that can be used without too much hassle - the site is lined from both at the top and bottom of this post.
Let us assume we need a small cluster with 200 TiB usable that will have many (relatively) small files but we don't need a lot of data IOPS. First, we enter R6 in filter window, to filter out RAID 1 and DDP configurations. Then sort by BeeGFS TiB:
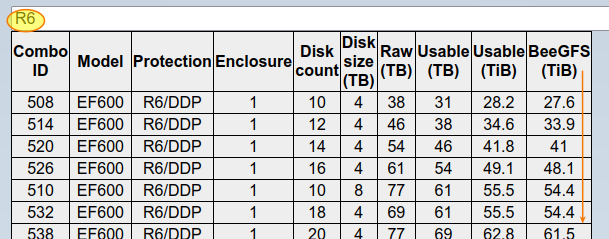
Now we pick a configuration we like. Here I like EF600 Hybrid over E5760 because we'll want to use SSD disks for metadata and EF600 Hybrid can accommodate SSDs in controller shelf.
We choose the smallest NL-SAS spindle size available in this table (here 40 8TB NL-SAS would fit as well, if we had it in the table - I don't because 4TB and 8TB are rarely used in big clusters).
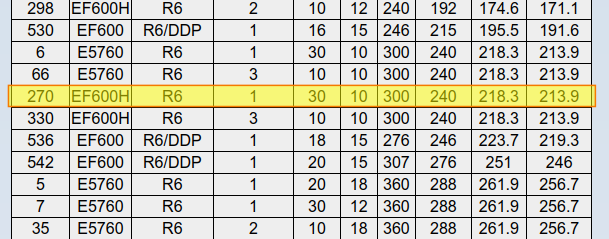
This is easy to remember - EF600 Hybrid with 30 10TB disk (3 RAID 6 (8D2P) groups).
Metadata is next. We know this cluster has more small files so let's take four percent of 220TiB which is 8.4TiB usable, and find a RAID 1 configuration with 8-10 TiB usable.
We replace R6 with R1 in filter and then sort by Usable TiB. Six 3.84TB disks in one RAID 10 group gives us 10.9TiB for Metadata. In this case we'd create a single RAID 10 group with two metadata volumes, one per BeeGFS server. More commonly we create a pair RAID 1 or RAID 10 groups with one metadata volume on each, but we can't do that with six SSDs.
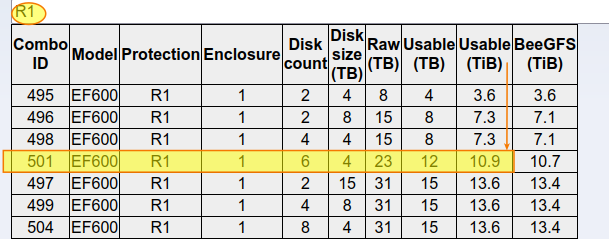
Note that this screenshot shows EF600, but we don't need a dedicated EF600 unit here - we can use the EF600 Hybrid we already picked for Data.
When files are many, sometimes there is a file count and MD performance requirement. Assuming 300 million files per TiB, 10TiB should be able to store over 3 billion files. In this case we should also determine optimal BeeGFS settings. For example, 200 TiB with 3 billion files means 66 KB average file size. If many files are smaller than that, they may waste capacity and we may need to take a closer look at how that impacts Data capacity requirement.
This example is somewhat contrived (many people would just pick all-flash EF600 these days), but I wanted something that didn't require a lot of scrolling on that page. How would we do that with SSDs alone? One example from the table that requires 20 slots using 15.3TB SSDs for Data and Metadata:
- 2 x 15.3TB (RAID 1 for Metadata) - 13.4TiB
- 18 x 15.3TB (DDP for Data) - 219.3TiB
Later I've added additional options which let me size multi-array clusters in less than 60 seconds:
- Forward sizer for RAID6 and DDP (for Data)
- Reverse sizer for RAID1 (for Metadata)
A demo of using this Web sizer can be viewed here (1m22s).
Conclusion
This approach doesn't give a single solution, but it helps me narrow thousands of possible combinations to just a handful, which I can review and narrow down to 2-3 most promising approaches.
It takes 10 seconds to start Jupyter, five to key in Min/Max values and hit Run, and probably around 30 to find best candidates.
For comparison, it can take up to one minute just to open a new browser tab, authenticate with 2FA and have a heavy sizing application load. And from there we still have to do run the tool half a dozen times to find what takes just 30 seconds in Jupyter.
An Web app with based on this concept is available here. It doesn't create charts and row filtering is limited, but it does 85% of what my Jupyter notebook can do and provides manual sizers for Data and Metadata which I don't have in Jupyter.