Monitor Snapshot Consistency Groups of NetApp E-Series SANtricity OS
- Problem statement
- Considerations
- SANtricity UI
- Consistency Group Sensor for PRTG
- What's missing but would be nice to have
- Conclusion
Problem statement
SANtricity OS supports Snapshot Consistency Groups (I like to call them CGs) and while it's easy to use the basic CGs features, it's not that easy to monitor them.
I think that's both due to the UI and the API.
You can see this post for more on how E-Series Consistency Groups.
Assuming other parts (volumes, DDPs, snapshots) have been taken care of (and they mostly have - you can see older posts on PRTG on the archive page), how would we go about monitoring CGs?
Considerations
As you can see in SANtricity screenshots below, most - if not all - of what we want is available in SANtricity Web UI, but you need to click around several times to get to it and sometimes you know just a figure (the snumber of CG snapshots, for example) rather than see a long list, especially since CGs usually have multiple volumes, so a CG with 4 volumes and 3 snapshots will have a snapshot list of 12 entries.
The other challenge is some things aren't available, or are available in another area of the Web UI, such as performance statistics.
SANtricity's performance monitor lets you pick selected volumes and obtain aggregate measurements, but you need to do that every time you visit the page. While you can also add a CG's volumes to a workload (which basically tags them with a workload ID), that means you need to have a workload defined and that's another burden.
SANtricity UI
This is to remind you how it looks like and what we look at.
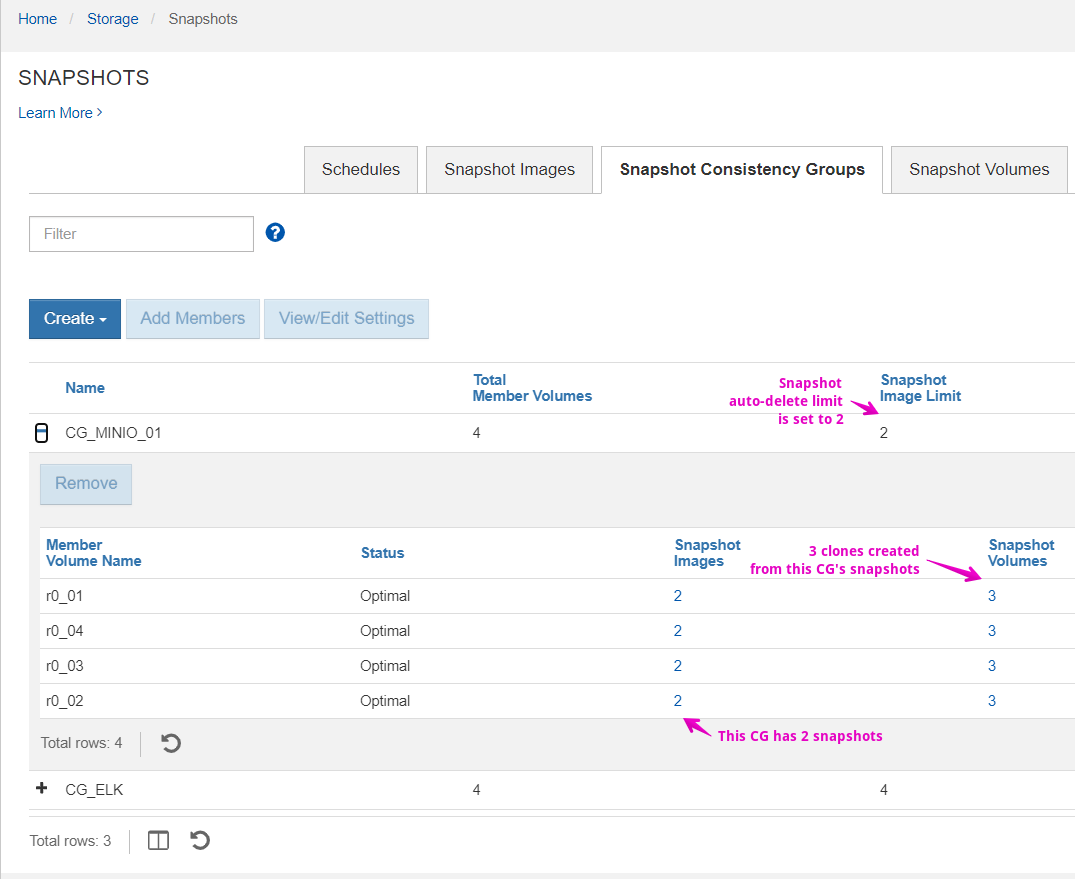
Normally we create a CG and add volumes to it. As we take snapshots or make clones, the count in those two columns increases. You can see here this CG limits the number of CG snapshots to just two.
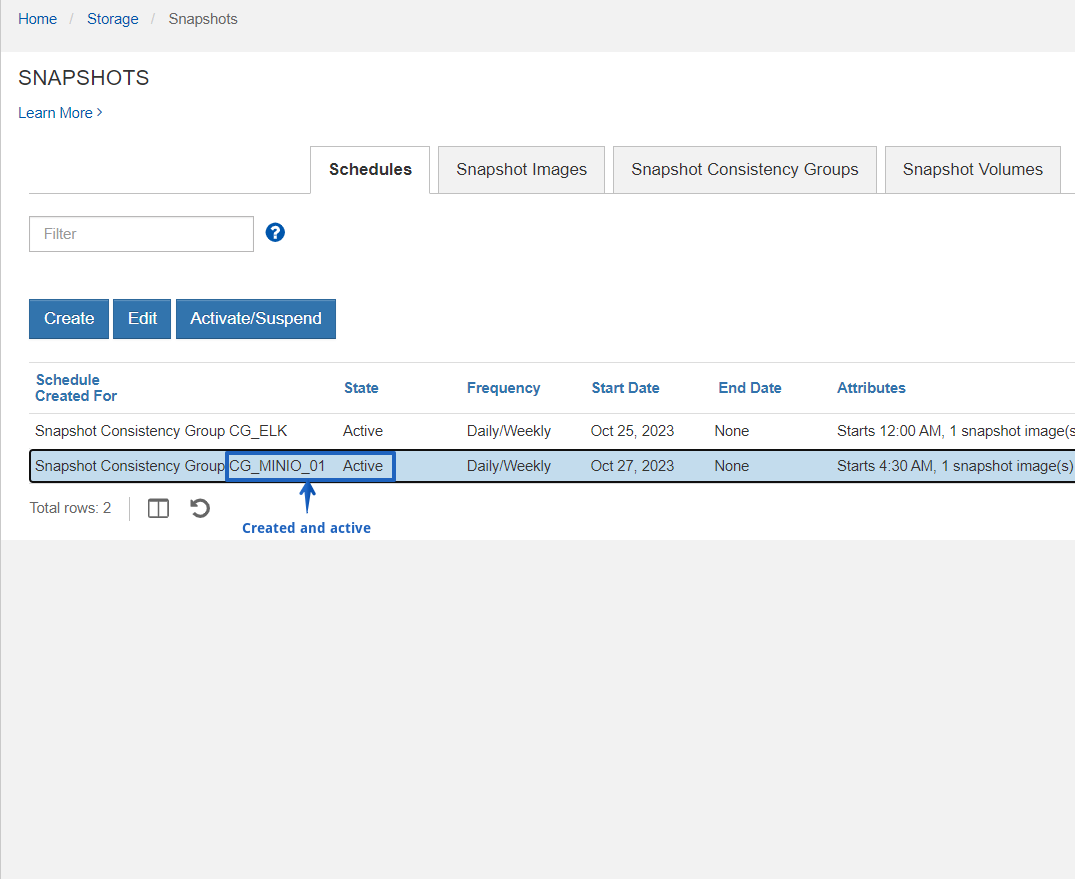
We may take on-demand or scheduled snapshots. Scheduled CG snapshots may have just one schedule per CG.
Snapshots can be multiple, up to 32 per CG, but we can set an auto-delete limit for our CG.

Above I showed this CG has the limit of two snapshots. But multiple clones can be created from each snapshot, so as an example we can have 2 snapshots and 3 clones (2 from the first snapshot, 1 from the second).
Clones (SANtricity annoyingly calls them "snapshot volumes") can be made from existing on-demand snapshots, but if auto-delete limit exists that on-demand snapshot may remove the oldest snapshot (I haven't actually checked, but I would if I needed to ensure no silent snapshot deletion occurs).
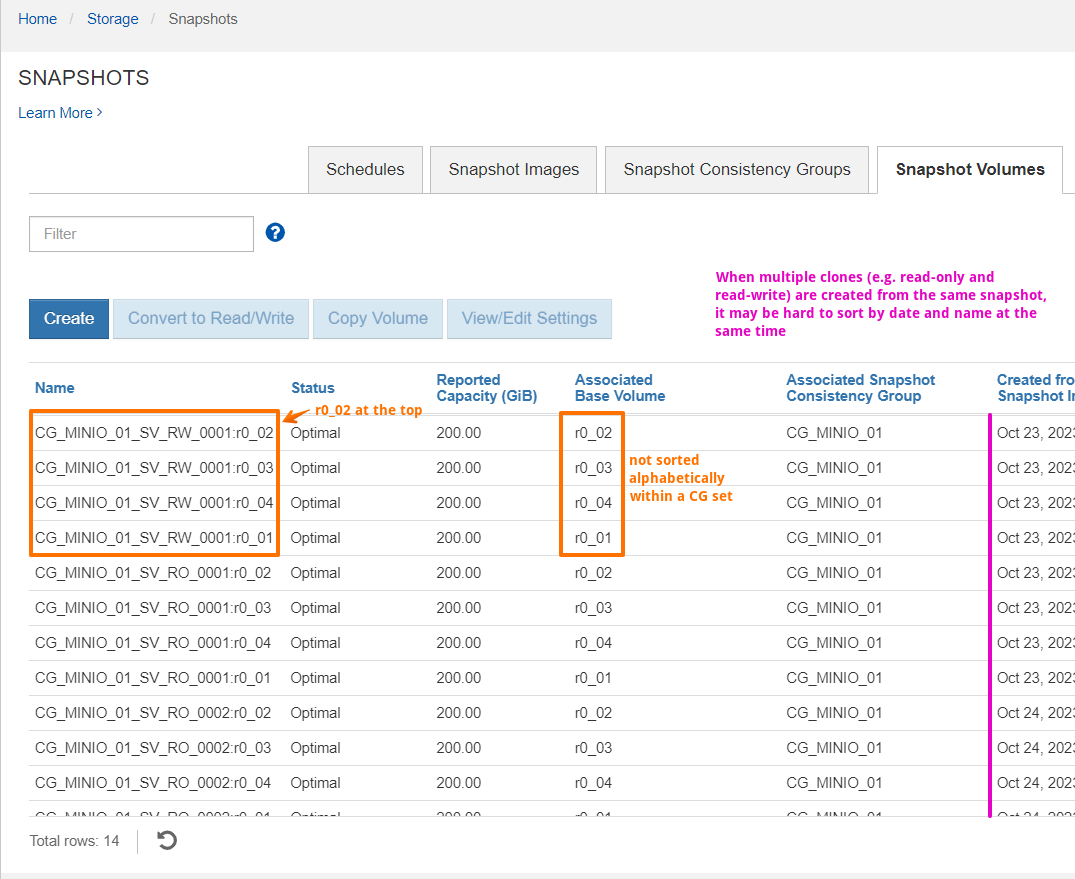
This Snapshot Volumes tab shows there's 3 clones although they're based on 2 snapshots from the other tab, which is the scenario mentioned above.
There's also a performance monitoring section where we can watch performance.
If we're not willing to create a "workload" (i.e. tag all volumes from the CG), they won't be automatically tagged even though they belong to the same CG, so we'd have to select which volumes to monitor every time we visit the page.
Consistency Group Sensor for PRTG
Like with other recent examples related to E-Series monitoring, I created this example for PRTG.
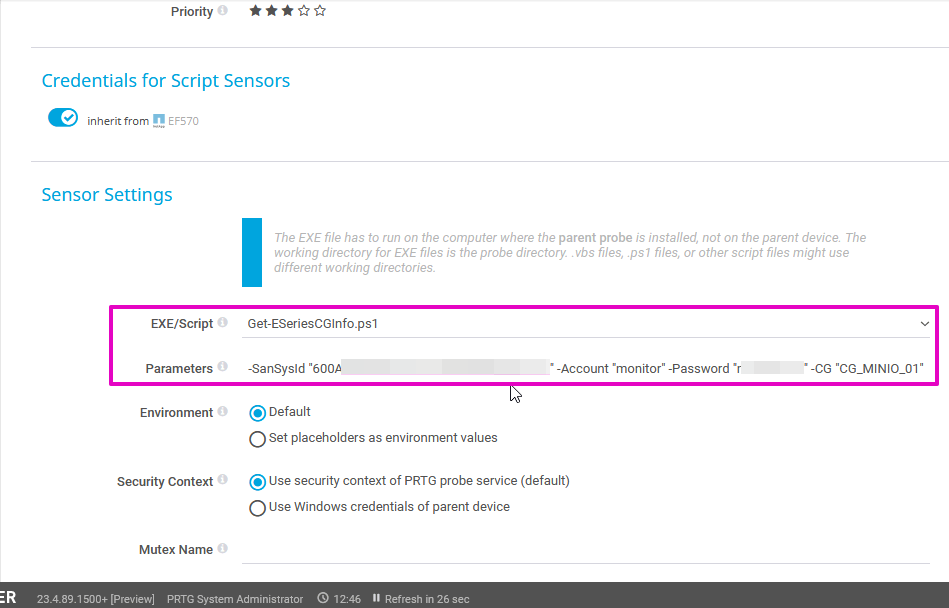
The monitor ("sensor") takes CG name as parameter. SANtricity mandates that CG names must be unique, so that's fine - there's no need to use the long alphanumeric CG ID.
Once the sensor script runs successfully, we can see what it fetches. For an example, our last read-only CG clone was created 108.51 hours ago and the limit for CG snapshots is 2 (that's our CG's auto-delete limit for the number of CG snapshots).
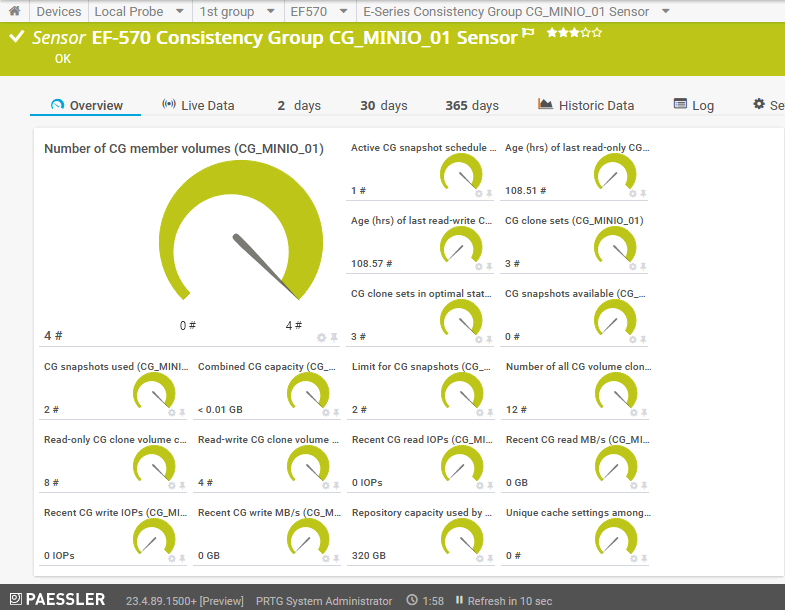
As text:
- Number of CG member volumes - for general awareness
- Combined CG capacity - for general awareness
- Recent CG read/write throughput/IOps - for easier - but not precise - aggregate monitoring of throughput and IOps, split by read and write (4 counters)
- Repository capacity used by CG clones - to see how much capacity is spent on clones
- Read-only CG clone volume count - clone of each individual member volume counts
- Read-write CG clone volume count - clone of each individual member volume counts
- Number of all CG volume clones - sum of read-only and read-write CG clone volumes, to understand the cost in number of volumes
- CG clone sets - this counts one clone of CG as one clone, regardless of the number of volumes
- CG clone sets in optimal state - ideally all, but at least some, should be in optimal state
- Limit for CG snapshots - is there an auto-delete limit? If not, 32 is the default and maximum
- CG snapshots used - how many are being used
- CG snapshots available - how many are available for taking
- Unique cache settings among CG members - we want just 1 set of settings, i.e. consistent settings across all members
- Age of last read-only CG clone - how many hours since last read-only clone was created?
- Age of last read-write CG clone - how many hours since last read-write clone?
- Active CG snapshot schedule - is snapshot schedule available and active?
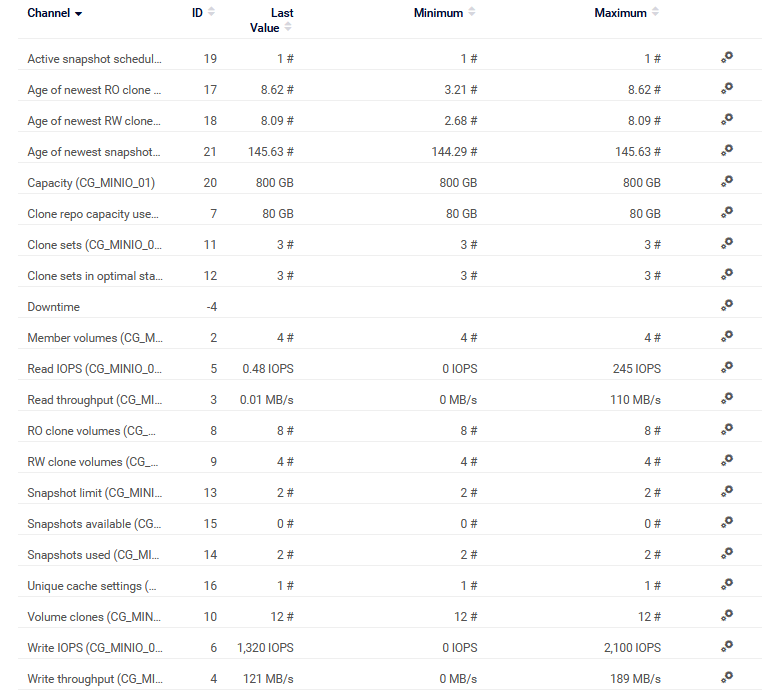
The same thing in table format after some changes and improvements:
The same in live chart with selected performance indicators.
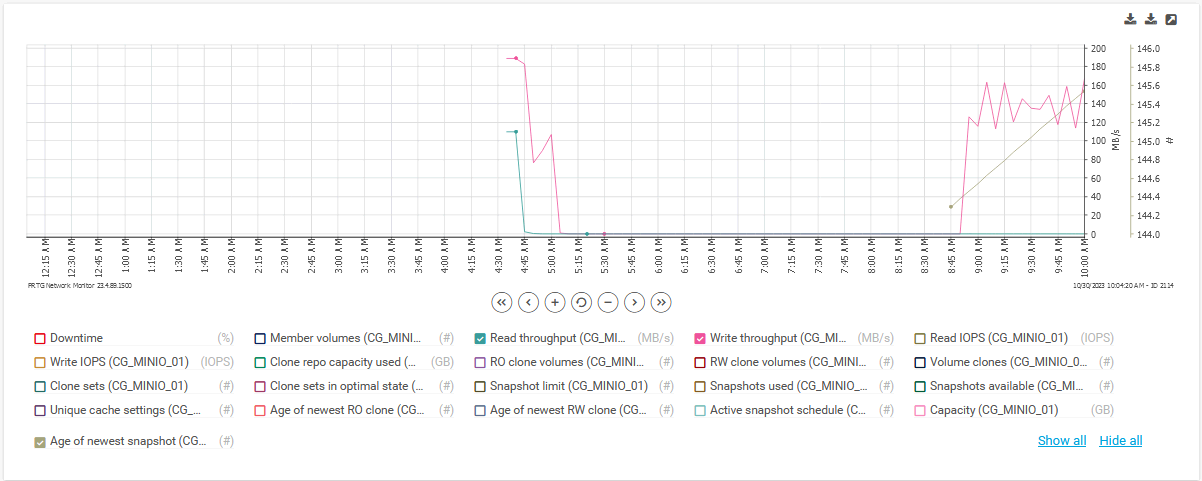
The second Y axis shows the age of most recent snapshot, which is why it increases as straight line. It reaches 145.6 hours.
What's missing but would be nice to have
Among metrics or indicators that I'd like to add (if I used this sensor myself) is additional comparisons of other volumes settings, to make sure they're consistent with my objectives. Normally people don't change volume settings at all, but if you do, and if you don't do it on all volumes (e.g. on volumes added to the CG later), then you end up with discrepancies that may be hard to discover. Or, you may have asymmetric workload (Postgres data + Postgres logs) and therefore two different sets of advanced volume settings, but even in that case you'd want to know you have 2 and not 3 different volume segmentSizes.
This could be valuable for people who are advanced users and frequently change their CGs (extend the number of volumes in CG, resize member volumes, modify volume settings, etc.). I think not many people do that.
Another thing that's missing - due to the weird behavior of SANtricity OS - is easy detection of missing clone set members. Let's say we have the same situation that we see in the screenshots above. Because there's 2 snapshots and 3 clones created from snapshots, we'd have 12 clone images from these 3 CG clone "sets". Now if we deleted one image from the most recent CG clone set, we'd have 11 clone images and the latest clone set would be partial and therefore invalid.
Obviously, we wouldn't knowingly do it but if we delete clones it's done volume by volume so it's easy to do it by mistake, especially when dates and times are so hard to compare by looking at the Snapshot Volumes tab (see that screenshot above).
The reason I didn't try to implement this indicator is it'd have to be some sort of alert. There is "CG clone sets in optimal state" which hints at the idea that if the number of CG clone sets in optimal state becomes lower than the number of CG clone sets, that's when we could warn.
I guess this would be useful for environments where a lot of clone operations are done from the Web UI and man-made mistakes are likely. A better way to address this is to automate the creation and deletion of clones.
Conclusion
This sensor maybe has too many indicators, but we don't need to use all of them.
Most of them can't be viewed on a single page in SANtricity, some can but not conveniently, and some are not available at all.
Among the inconvenient indicators (in SANtricity) I'd single out CG performance metrics, capacity, and various dates (when a snapshot or clone was taken) - if you have more than one, it's very hard to sort and see them in the UI.
Among the unavailable (in SANtricity), I'd single out the "number unique cache settings" among CG member volumes. While similar indicators can be produced for other properties, this is just an example of an important one: if cache is not consistently configured and the workload is uniform, then seeing there's 2 or 3 different volume cache settings means we need to fix it.
As far as the various numbers of this or that are concerned, most aren't that important, but the limit on CG snapshots is 32, and it's even smaller if auto-delete is set. Combined with the age of recent clones, and information on snapshot schedules, this give us good information about the status of CG's protection.
If there's no active snapshot schedule, the most recent clone is 1,457.54 hours old, and the number of snapshots is 1, we should better go to SANtricity to take a closer look - create a schedule, delete old snapshots, etc.