Hardware monitoring of NetApp HCI compute nodes for dark sites
NetApp HCI compute nodes are normally monitored from mNode, which is a VM that fetches events from both storage and compute nodes.
But if your environment is disconnected from the Internet, you can enable SNMP and send email alerts as with any standard server with management controller.
My preferred approach is to enable SNMP and forward logs to your centralized monitoring platform - whether it's old school SNMP monitoring or something modern like Splunk.
If you have Grafana in your environment, HCICollector v0.7 has some examples of how you could monitor NetApp HCI compute nodes in Grafana. While these examples are for hardware monitoring, they can be adjusted to monitor for hardware events. Grafana can send email alerts, so it is possible to send events to a Grafana backend via SNMP, and use Grafana to send email alerts in the case of a problem.
If you just want to send emails in the case something breaks, you can do that as well.
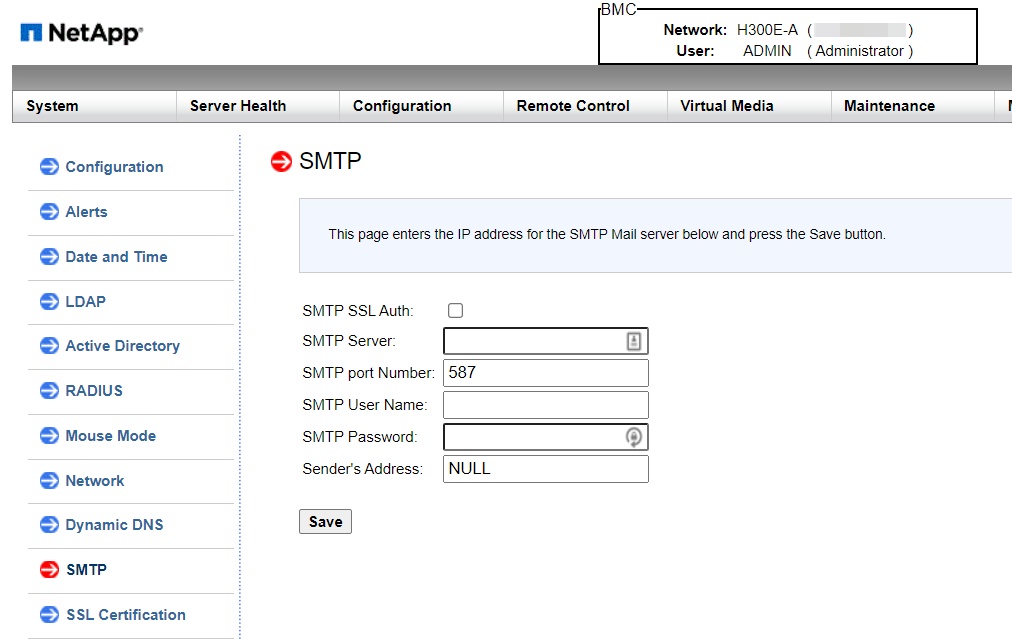
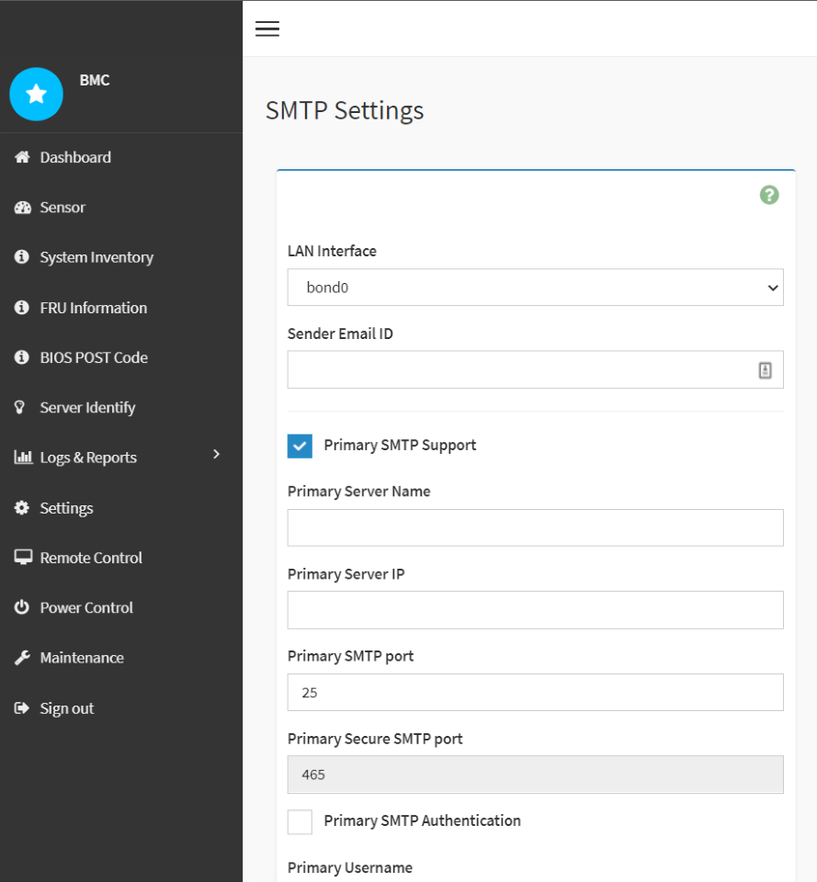
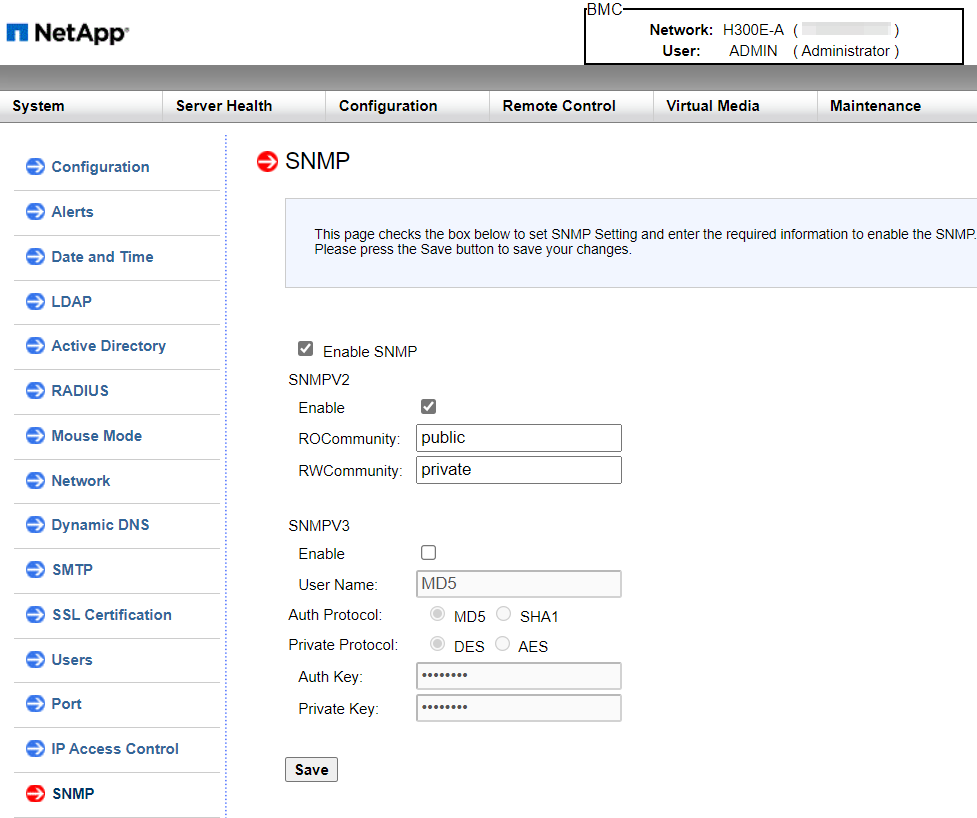
If your IPMI isn't connected or you can't access it, these sample screenshots may give you an idea of what inputs are required to enable SNMP or SMTP.
awesome-solidfire has some additional details on the topics of alerting and monitoring.
SMTP
- H300E, H500E, H700E, H410C
- H610C, H615C
SNMP
- H300E, H500E, H700E, H410C
- H610C, H615C
