Monitor SolidFire Network with SolidFire-Exporter, Prometheus and Grafana
In the first solidfire-exporter post I went through the first two steps required to gather SolidFire (or NetApp HCI) data and get it into Prometheus. I also said I'll write additional posts as I find time and opportunity.
In this post I'll describe additional steps related to a practical requirement (more on that later):
- Install and configure Grafana
- Add Prometheus (which is gathering data from solidfire-exporter, which we set up in the first post) to Grafana sources
- Import
solidfire-exporterreference dashboard(s) to Grafana
I assume you installed solidfire-exporter and Prometheus. Remember the Prometheus IP address (e.g. 127.0.0.1) and port you chose here (e.g. 9090).
I'm now going to install Grafana on the same system (Ubuntu VM) so I can have Prometheus bind a loopback interface (such as 127.0.0.1) and cut corners on security (not use HTTPS and hence avoid the need to create TLS certificates). solidfire-exporter is also on a loopback interface as Prometheus is on the same node, so all services except Grafana (:3000) will be self-contained within a VM.
Download and install Grafana. The latest stable version is v7.5.6. There's a v8 beta, but I don't want more troubles than I already have so I passed on that.
For Ubuntu and Debian, enable and start service as per this link. Then access the VM's http://ip-address-or-fqdn:3000 and login with admin/admin.
At this point we need two things to see our SolidFire stats:
- Data source (
solidfire-exporterexports to Prometheus and we have it already running) - Dashboards (which you can create on your own, but solidfire-exporter authors have three nice dashboards uploaded to grafana.com so we'll use those)
Add a data source (your Prometheus data source).
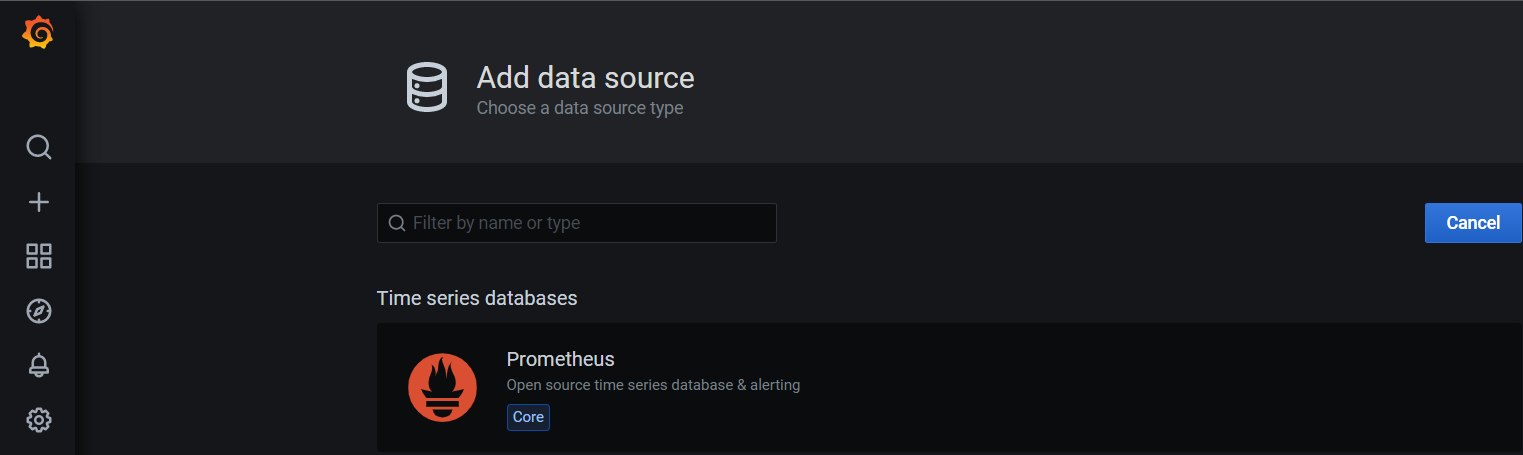
Like I said, my Prometheus is running on port 9090 so I had to remember to not accept the default port value. Or change your Prometheus config file to use port 9000.
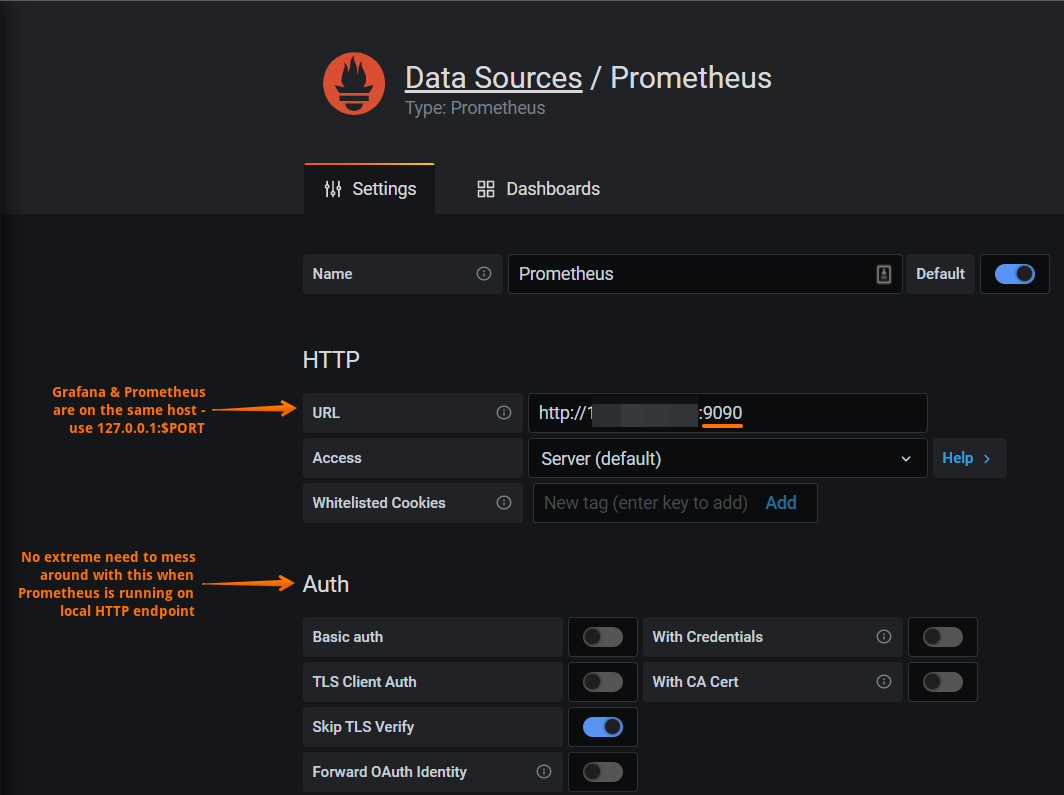
At the bottom of this page, use the "test and save" button to make changes.
Finally, import one or more solidfire-exporter's Grafana dashboards. You can find links and dashboard IDs at the solidfire-exporter project page on Github.
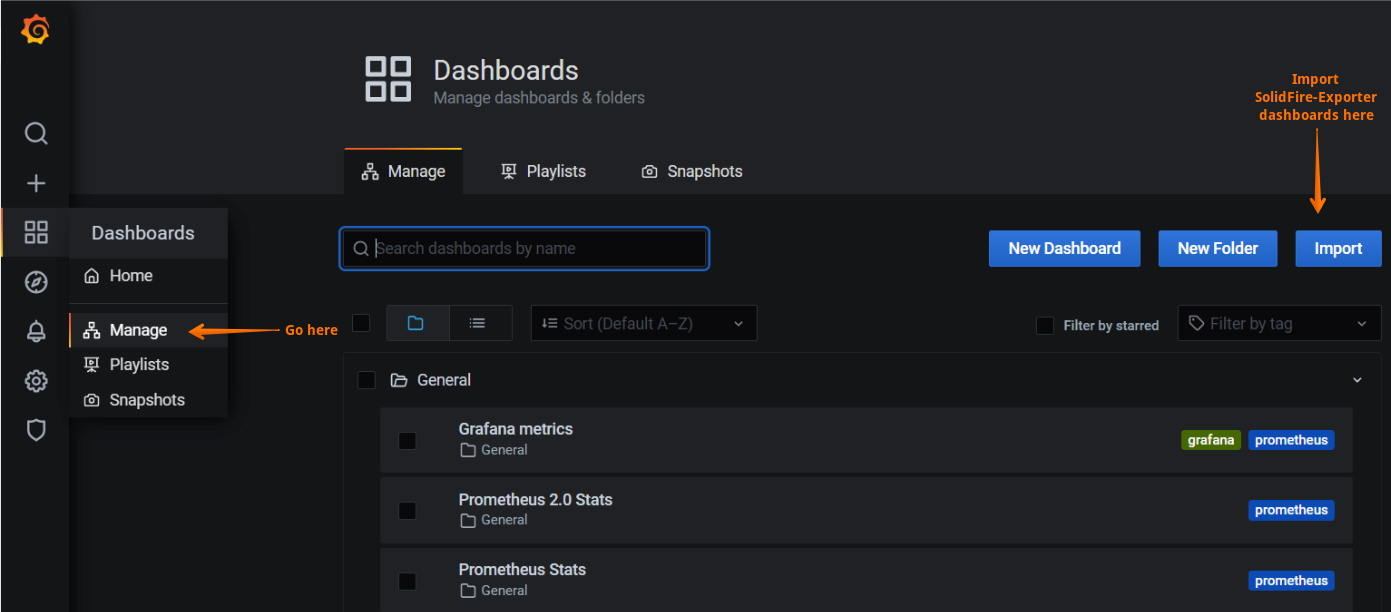
My objective - and the excuse for today's post - was to observe network interface utilization while using SolidFire's volume backup (to S3) feature. That - storage nodes' network interfaces - is a node thing, so I only used Dashboard ID 14026 (at the moment) which is a dashboard with SolidFire node details.
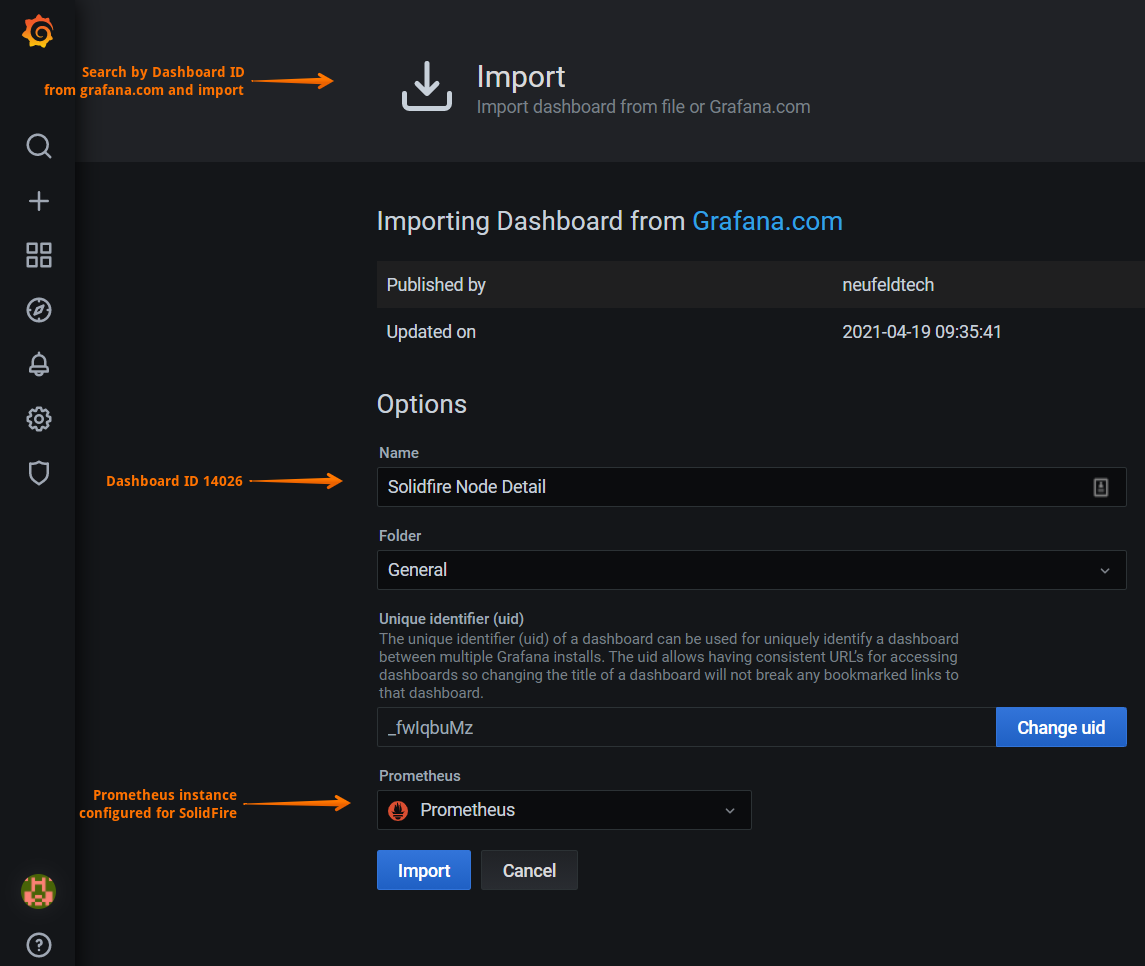
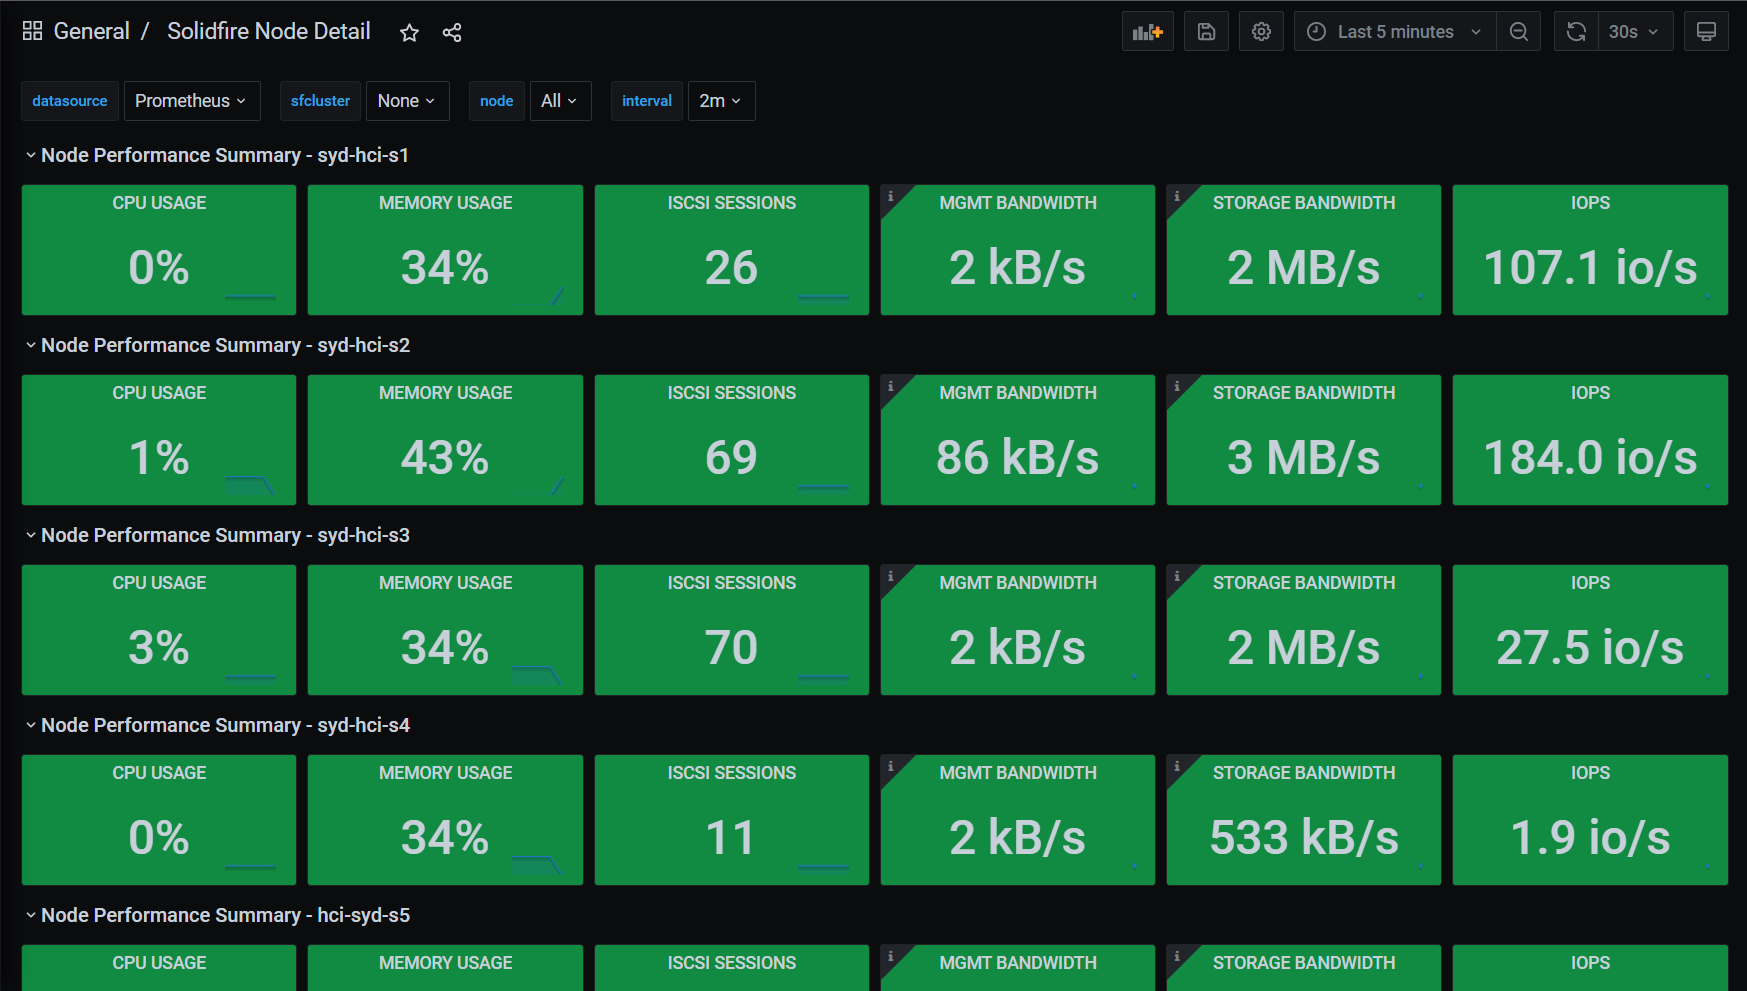
I first confirmed that everything is working as expected.
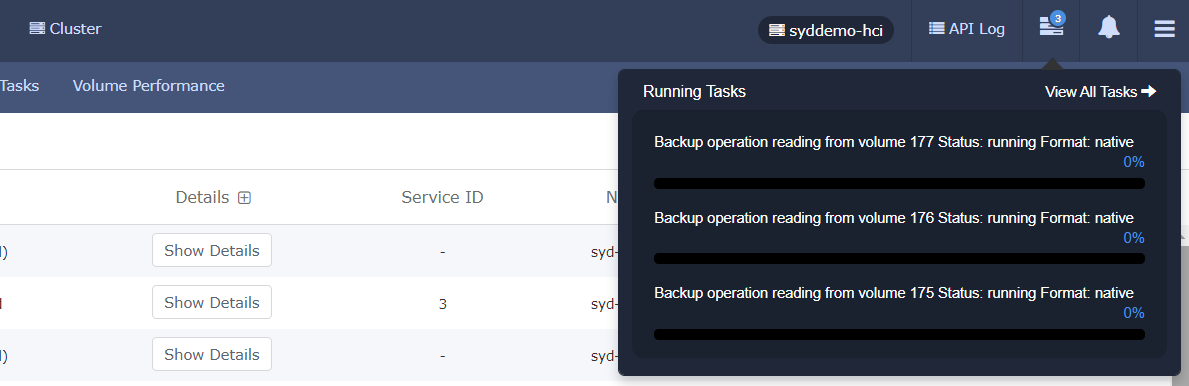
Then I started three SolidFire backup jobs.
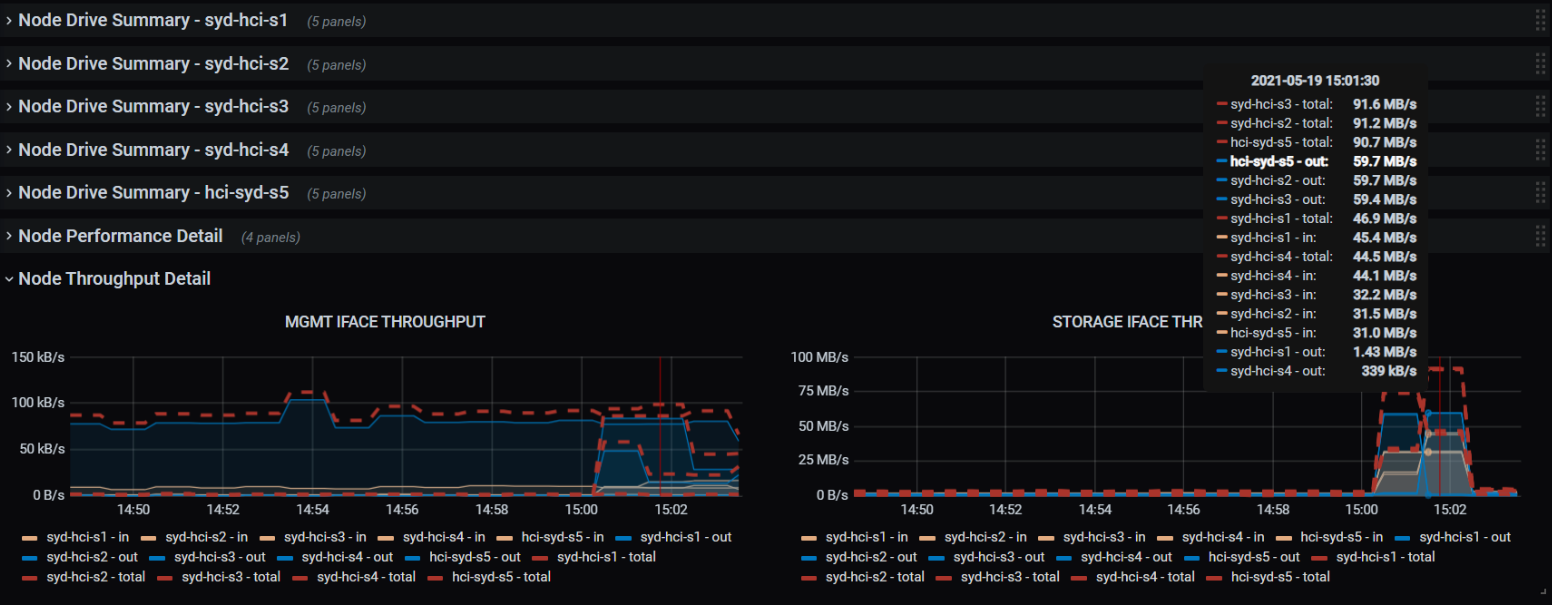
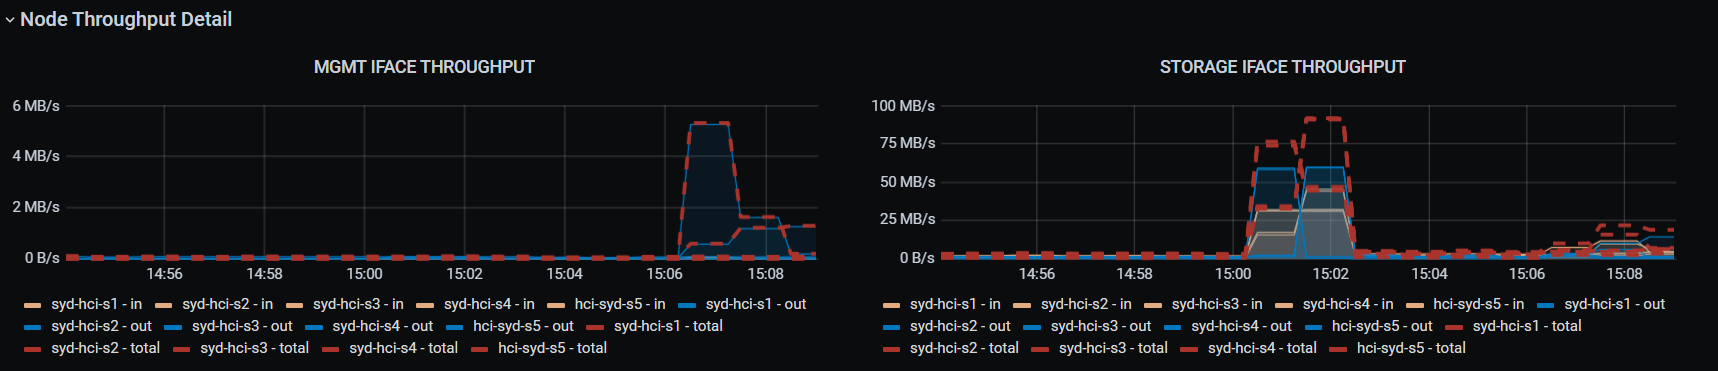
Upon going back to Grafana I noticed a deceiving spike of traffic on the iSCSI interfaces:
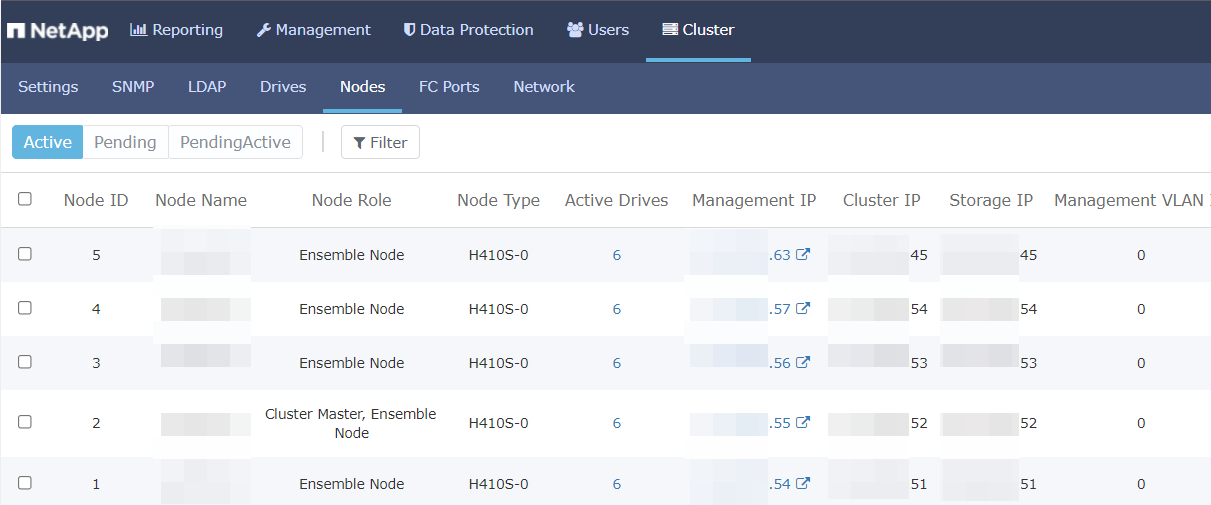
To verify this traffic is indeed coming from SolidFire storage nodes' iSCSI interfaces, I went to see which node IP addresses are used for management and iSCSI, respectively.
Is it seems like all the action is happening on the iSCSI interfaces! (Open image in new tab for a sharper picture.)
But when I looked at the last decimal of the IP addresses of the clients connecting to S3 service port (:443) I saw this:
$ sudo netstat -ant | grep ":443" | awk '{ print $5}' | uniq | sort | awk -F "." '{ print $4}'
0:*
56:34288
56:34310
56:34312
[...]
63:56004
63:56786
63:56788
63:56790
63:56792
63:56794
[...]
Wow! Indeed, those are Management IPs from nodes with IDs 3 and 5!
It seemed like data reads occur over the iSCSI interfaces, but backup data is in fact sent out of the Management interfaces.
What if we wanted to use the iSCSI network for backup traffic (to S3)? Without changes in SolidFire one option is to stand up a transparent forward proxy VM or container (NGINX, for example) to provide S3 service on Management Network and move data over the network used for iSCSI. Normally we'd use a dual-homed (i.e. with two network interafaces) VM or container or one just interface with custom routes (not such a great idea if you want to properly segregate Management and iSCSI networks).
Or you can always clone & backup entire volumes directly over iSCSI - all it takes is to clone a volume, login to cloned target volume and read clone device data while piping it to a backup utility of your choice as described in that post.