SolidFire monitoring with Elasticsearch
- Problem
- Log Forwarding with syslog-ng
- Status Polling with http_poller
- SNMP Trap Monitoring
- Creating Charts and Visualizations
- Video Demo
- Conclusion
- Appendix A: Software Used
- Appendix B: Structured Log Monitoring Notes
- Appendix C: Unstructured Log Monitoring Notes
- Appendix D: http_polling Examples
NOTE: Passwords and credentials are from lab systems.
Problem
We want to monitor SolidFire with ELK stack. What now?
I'd recommend one or more of these three approaches:
- Log forwarding
- Status polling
- SNMP monitoring
This isn't to say there aren't other ways - especially indirect (we could pull data from Grafana that feeds on data collected by HCI Collector, for example) - but that you probably don't need more than two.
Note that all screenshot images can be opened in new tab for clearer view.
Why ELK
Yes I know there are other stacks and each has some advantage over ELK as whole or individual components.
But this is for ELK, because there's a lot of it out there.
Log Forwarding with syslog-ng
There are several ways to do this. I used the following approach:
- Forward SolidFire logs to a VM running syslog-ng
- In syslog-ng, save SolidFire log to
/var/log/solidfire.logusing ISO8601 timestamp (or other of your choosing) - In Filebeat running on the same VM, pick that log, remove some junk, and send the rest to Logstash
- In Logstash, send the data to Elastic
It's not a fixed approach and it's not "the best" approach. It's just an approach.
You can use rsyslog, or something else. You could also make things simpler and remove Filebeat or even syslog-ng out of this workflow - it's entirely up to you.
Challenges with SolidFire Log Forwarding
The main one is to realize that SolidFire log isn't really a log. It's a bunch of different logs (JBODL?) from one source.
Or, more precisely, it's a bunch of different logs from different SolidFire services coming from one cluster. And the logs aren't necessarily structured the same.
Here's an example:
2021-10-18T01:53:37+00:00 192.168.1.33 slice5[7385]: {"action":"SessionStats","idg":"1982029371179181","idx":117806,"system":"ISCSI","utc":"2021-10-18T01:53:37.283651Z","ver":"1.1","xISCSISessionStats":{"LoginMSecs":{"avg":null,"ct":0,"max":null,"min":null,"std":0,"tmax":0,"tmin":0},"RedirectCount":0,"RedirectMSecs":{"avg":null,"ct":0,"max":null,"min":null,"std":0,"tmax":0,"tmin":0},"ServiceID":4,"SessionCount":13}}
2021-10-18T01:53:40+00:00 192.168.1.33 master-1[5540]: [MS] 8992 CapacitySampler ms/ClusterCapacity.cpp:75:CapacityThread|Taking a Cluster Capacity sample.
2021-10-18T01:58:02+00:00 192.168.1.33 master-1[5540]: [APIClient] 7430 master-1 httpserver/RestAPIClient.cpp:246:SendCommandRaw|curl_easy_perform failed result=7 errorbuffer=Failed to connect to 192.168.1.30 port 443: No route to host
2021-10-18T01:59:02+00:00 192.168.1.33 block7[7378]: {"action":"DriveStats","idg":"2449920755878951","idx":18700,"system":"Component","utc":"2021-10-18T01:59:02.329866Z","ver":"1.1","xComponentDriveStats":{"PercentInUse":[60,50,48,48,6,0,0,0,0,0,0,0,0,0,0,0,0,0,0,0,0,0,0,0,0,0,0,0,0,0,0,0,0,0,0,0,0,0,0,0],"TotalActiveData":2843353090,"TotalDiscardedData":2682642430,"TotalUnusedSpace":48161095680}}
2021-10-18T01:59:12+00:00 192.168.1.33 master-1[5540]: {"action":"ApiCall","idg":"940460905823515","idx":156655,"system":"Cluster","utc":"2021-10-18T01:59:11.986249Z","ver":"1.1","xClusterApiCall":{"Method":"GetVasaProviderInfo","SourceIP":"192.168.1.33","Threads":1,"Time":0,"Username":"vasa_admin_72k4"}}
Solving Single-Log-Many-Formats Challenge
Given that various SolidFire services have different log structure, we have to decide what to do with that.
I couldn't get anything smart to work, but I came up with two solutions, each of which sort-of-works but isn't greatest.
- syslog-based (with structure): filter incoming data and save stuff that you need to different log files (such as sfapi.log, sfevent.log, etc.). Then process log files differently according to their structure, and save them to different Elastic indexes. This would give us two or more formats, but they'd be structured.
- Kibana-based (no structure): use one heterogeneous log, and create Kibana queries that work around it by querying unstructured logs.
Structured Logs
SolidFire system log can be saved into multiple files with syslog-ng (or rsyslog), Filebeat and even Logstash.
To split a log, you need to decide how and then do it.
In syslog-ng, there you'd parse the the incoming log entries, use filter, if-else blocks and destination to save them.
If you haven't done it prior to Filebeat (or Logstash), you can use Filebeat features to achieve something similar. Or, if there's no Filebeat then use Logstash's pipeline-to-pipeline.
The point is, with the log sample above, you'll get more than one index collection. I settled on two:
- one for JSON-formatted ApiCall action messages (last row in the sample above): these are already structured. We want xClusterApiCall nested JSON for API logs
- one for
[MS]program messages, which usually contain useful notifications. There's also[API](similar to ApiCall, but not fully JSON-formatted) and[Event], each slightly different
Given the following line with JSON-based message content:
2021-10-17T05:33:55+00:00 192.168.1.33 master-1[5540]: {\"action\":\"ApiCall\",\"idg\":\"940460905823515\",\"idx\":86874,\"system\":\"Cluster\",\"utc\":\"2021-10-17T05:33:55.501699Z\",\"ver\":\"1.1\",\"xClusterApiCall\":{\"Method\":\"GetClusterStats\",\"SourceIP\":\"192.168.1.12\",\"Threads\":1,\"Time\":22,\"Username\":\"admin\"}}"
We could Grok such lines with something like this (I use ISO8601 in syslog-ng) and then use the JSON content to overwrite the original message entry:
%{TIMESTAMP_ISO8601:iso8601_timestamp} %{IPV4} %{SYSLOGPROG:program}: %{GREEDYDATA:json_message}
Result:
{
  "json_message": "{\\\"action\\\":\\\"ApiCall\\\",\\\"idg\\\":\\\"940460905823515\\\",\\\"idx\\\":86874,\\\"system\\\":\\\"Cluster\\\",\\\"utc\\\":\\\"2021-10-17T05:33:55.501699Z\\\",\\\"ver\\\":\\\"1.1\\\",\\\"xClusterApiCall\\\":{\\\"Method\\\":\\\"GetClusterStats\\\",\\\"SourceIP\\\":\\\"192.168.1.12\\\",\\\"Threads\\\":1,\\\"Time\\\":22,\\\"Username\\\":\\\"admin\\\"}}\"",
  "iso8601_timestamp": "2021-10-17T05:33:55+00:00",
  "pid": "5540",
  "program": "master-1"
}
I haven't yet tried to create working Grok or other examples with [MS] and similar logs. Using the same Grok filter, the entire content gets stuffed into json_message which is unlikely to survive conversion to JSON. We'd need to process such entries differently.
{
  "json_message": "[Event] 8970 PionScheduler serviceshared/EventReporter.cpp:582:ReportEvent|Successfully reported event={id=47307 type=ApiEvent nodeID=1 message=[API Call (CreateSnapshot)] details={\"context\":{\"ip\":\"192.168.1.12\",\"user\":\"admin\"},\"method\":\"CreateSnapshot\",\"params\":{\"name\":\"elastic-snapshot\",\"requestAPIVersion\":\"11.0\",\"retention\":\"0:5:00\",\"volumeID\":484},\"success\":true} reported=2021-10-18T05:01:23.480432Z published=2021-10-18T05:01:23.480489Z} mNumEventsPublished=5",
  "iso8601_timestamp": "2021-10-18T05:01:23+00:00",
  "pid": "5540",
  "program": "master-1"
}
If we used JSON decoding on a SolidFire log with mixed log types, lines with [MS] and [Event] in them could get tagged with [_jsonparsefailure] (see here), so although that would fail, it'd still give us a way to find those failed entries (or send them to their own index set) where we could use unstructured search on them.
Get Events and Faults Completely from API logs
Can we just forget about [MS], [API], [Event] and such, and get Events and Faults from JSON formatted logs? Let's try.
$ cat /var/log/solidfire.log | grep "\"action\":\"Fault"
2021-10-18T02:55:05+00:00 192.168.1.33 master-1[5540]: {"action":"Fault","idg":"940460905823515","idx":159046,"system":"Cluster","utc":"2021-10-18T02:55:04.650426Z","ver":"1.1","xClusterFault":{"Code":"ClusterIOPSAreOverProvisioned","Details":"The sum of all minimum QoS IOPS (5300) is greater than the expected IOPS (3000) of the cluster. The minimum QoS can not be maintained for all volumes simultaneously in this condition. Adjust QoS settings on one or more volumes to not exceed available cluster IOPS.","DriveIDs":[],"FaultID":68,"HardwareID":0,"NodeID":0,"ServiceID":0,"Severity":"Warning","Type":"Cluster"}}
2021-10-18T02:55:05+00:00 192.168.1.33 master-1[5540]: {"action":"Fault","idg":"940460905823515","idx":159047,"system":"Cluster","utc":"2021-10-18T02:55:04.652291Z","ver":"1.1","xClusterFault":{"Code":"DisconnectedClusterPair","Details":"One of the clusters in a pair may have become misconfigured or disconnected.  Remove the local pairing and retry pairing the clusters. Disconnected Cluster Pairs: [11]. Misconfigured Cluster Pairs: []","DriveIDs":[],"FaultID":69,"HardwareID":0,"NodeID":0,"ServiceID":0,"Severity":"Warning","Type":"Cluster"}}
Using the same Grok line as above, these could result in valid JSON. We'd need some "fine tuning" to get to xClusterFault, but even without that this could be usable enough.
{
  "json_message": "{\"action\":\"Fault\",\"idg\":\"940460905823515\",\"idx\":159047,\"system\":\"Cluster\",\"utc\":\"2021-10-18T02:55:04.652291Z\",\"ver\":\"1.1\",\"xClusterFault\":{\"Code\":\"DisconnectedClusterPair\",\"Details\":\"One of the clusters in a pair may have become misconfigured or disconnected.  Remove the local pairing and retry pairing the clusters. Disconnected Cluster Pairs: [11]. Misconfigured Cluster Pairs: []\",\"DriveIDs\":[],\"FaultID\":69,\"HardwareID\":0,\"NodeID\":0,\"ServiceID\":0,\"Severity\":\"Warning\",\"Type\":\"Cluster\"}}",
  "iso8601_timestamp": "2021-10-18T02:55:05+00:00",
  "pid": "5540",
  "program": "master-1"
}
To evaluate this further, we included only a handful of JSON-formatted calls in Filebeat include_lines and dropped everything else.
- type: filestream
  enabled: true
  paths:
    - /var/log/solidfire.log
  fields:
    logtype: sfapi
  include_lines: ['.*{"action":"ApiCall".*', '.*{"action":"Config".*', '.*{"action":"ConnectionState".*', '.*{"action":"Create".*', '.*{"action":"Event".*', '.*{"action":"Exit".*', '.*{"action":"Fault".*', '.*{"action":"Heartbeat".*', '.*{"action":"LoginResponse".*', '.*{"action":"PhyDrive".*', '.*{"action":"PhyNetwork".*', '.*{"action":"PhyNode".*', '.*{"action":"PhyNodeSensors".*', '.*{"action":"PhyNvram".*', '.*{"action":"Role".*']
In Logstash, we use the same Grok rule as above (and overwrite is optional - as we store fields and values under sf_api):
filter {
  grok {
    "match" => { "message" => '%{TIMESTAMP_ISO8601:iso8601_timestamp} %{IPV4} %{SYSLOGPROG:program}: %{GREEDYDATA:message}' }
    overwrite => [ "message" ]
 }
 json {
   source => "message"
   target => "sf_api"
 }
}
This appears to work - searching for RestoreDeletedVolume:
sf_api.xClusterApiCall.Method : RestoreDeletedVolume
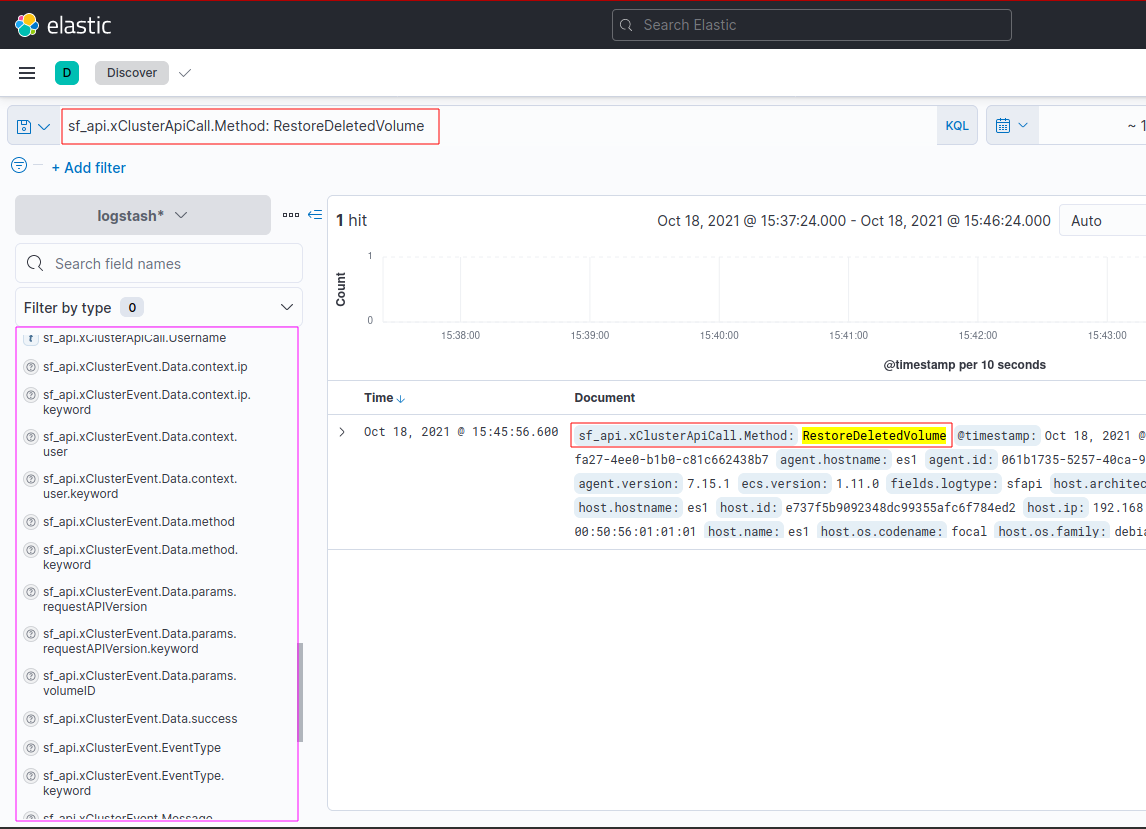
All right, so this is sort-of-solved, although additional improvements are possible.
In next section let's assume we didn't do any filtering and logs from all SolidFire services have hit the same Elastic index set: we have to search unstructured logs (in "message" field).
Unstructured Logs
Assuming the above proves too overwhelming, we could just send everything to Elastic and try to create unstructured queries that work around those problems.
Even in this case, I'd recommend two steps:
- Drop unnecessary lines in syslog or Filebeat or Logstash
- Create unstructured queries that search content in
messages
As an example, Filebeat has include_lines and we could use it to pick only the useful lines from the logs. In my simple tests useful lines were 1% of the total.
- type: filestream
  enabled: true
  paths:
    - /var/log/solidfire.log
  include_lines: ['.*{"action":"ApiCall".*', '.*{"action":"Config".*', '.*{"action":"ConnectionState".*', '.*{"action":"Create".*', '.*{"action":"Event".*', '.*{"action":"Exit".*', '.*{"action":"Fault".*', '.*{"action":"Heartbeat".*', '.*{"action":"LoginResponse".*', '.*{"action":"PhyDrive".*', '.*{"action":"PhyNetwork".*', '.*{"action":"PhyNode".*', '.*{"action":"PhyNodeSensors".*', '.*{"action":"PhyNvram".*', '.*{"action":"Role".*', '\[Event\] [[:digit:]]+', ' \[MS\] [[:digit:]]+ CFaultMon ', ' \[API\] [[:digit:]]+ PionScheduler httpserver/RestAPIServer']
If you want to spend an evening playing with this, you could split the above in two inputs, one with the JSON-based action stuff (like the above, just without non-action items) and one for [Thing]-based entries (example below)). In each we could have "fields.logtype" (see example below); the one above could be sfapi, the one below sfevents. Then try to process (filter) each type separately and send results to different indexes.
- type: filestream
  enabled: true
  paths:
    - /var/log/solidfire.log
  fields:
    logtype: sfevents
  include_lines: ['\[Event\] [[:digit:]]+', ' \[MS\] [[:digit:]]+ CFaultMon ', ' \[API\] [[:digit:]]+ PionScheduler httpserver/RestAPIServer']
This didn't work for me (it seems it was too simplistic; Filebeat maybe tracks just one file per instance), but I didn't try any workarounds (such as running two Filebeat instances, each for one type, or using the more advanced pipeline functionality). If you can't make it work either, just use the first filestream example that contains all include_lines that you'll probably need.
In any case, let us assume we couldn't split the log and now everything is in the same index group logstash-*. How can we query unstructured text inside message field (here even JSON is unstructured)?
Find CreateVolume actions can be found in Kibana (Analytics > Discover) with:
message: " [API] " AND message: "RestAPI::CreateVolume SUCCESS"
When looking for a particular volume name, use:
message: " [API] " AND message: "RestAPI::CreateVolume SUCCESS" AND "\"name\":\"elastic\""

Similarly, for DeleteVolume:
message: " [API] " AND message: "RestAPI::DeleteVolume SUCCESS"
It's not terribly convenient, but it works. Save such queries (see that floppy disk icon in top left corner) without the name value so that, when you want to use them, you just fill in a volume name.
Searching Unstructured Logs
One way is with trial & error, just look at all message contents and search for a keyword - say, a snapshot I created:
message: " elastic-snapshot"
You may get multiple lines back. Find the one you're interested in, and add additional search criteria. Rinse & repeat…
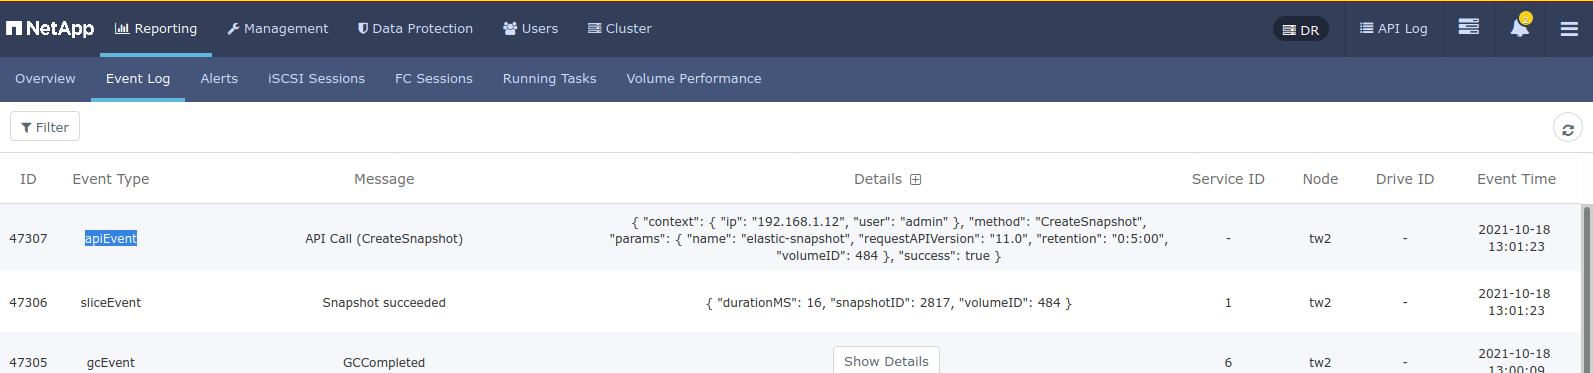
Another way is to go to SolidFire UI (Reporting > Event Log, or Reporting > Alerts depending if you're looking for all events or just faults) and examine what fields you want to focus on (i.e. filter by). You can open this screenshot in new tab, but you don't have to - the point is I figured it's ApiEvent that I'm after.
Then improve your Kibana query to eliminate false positives:
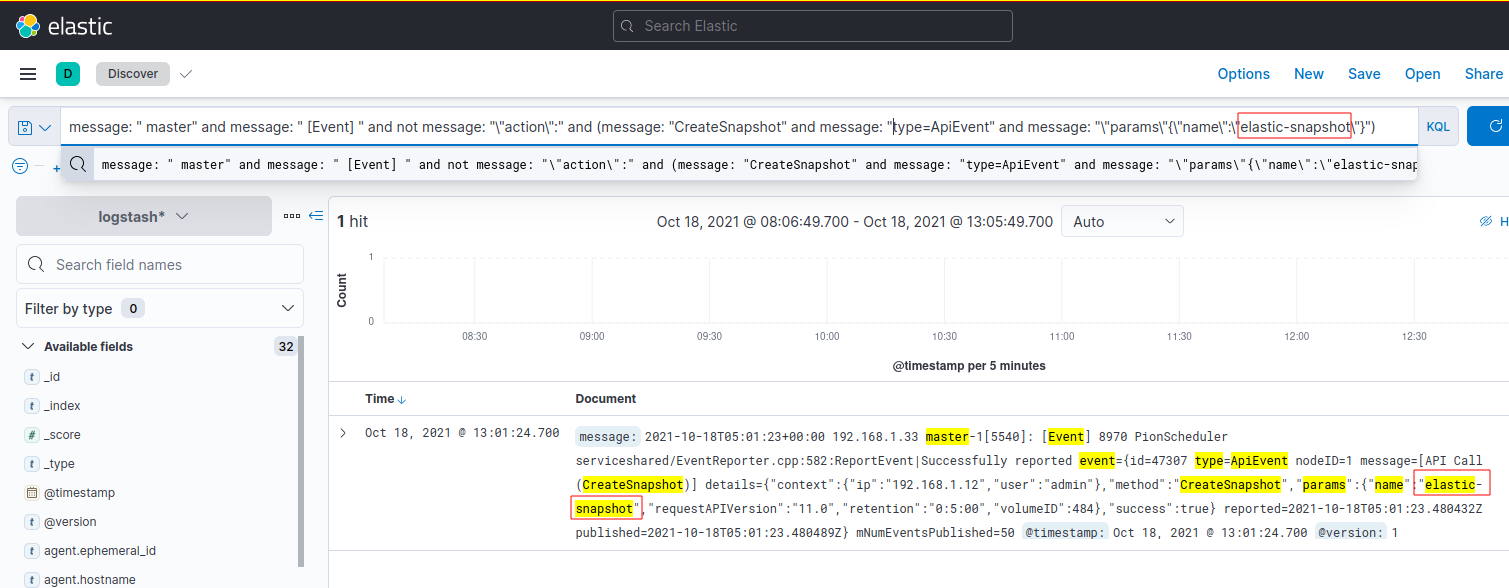
Final query to find non-scheduled CreateSnapshot activity related to the snapshot named elastic-snapshot:
message: " master" and message: " [Event] " and not message: "\"action\":" and (message: "CreateSnapshot" and message: "type=ApiEvent" and message: "\"params\"{\"name\":\"elastic-snapshot\"}")
If you expect to do this often, save this query in Kibana:
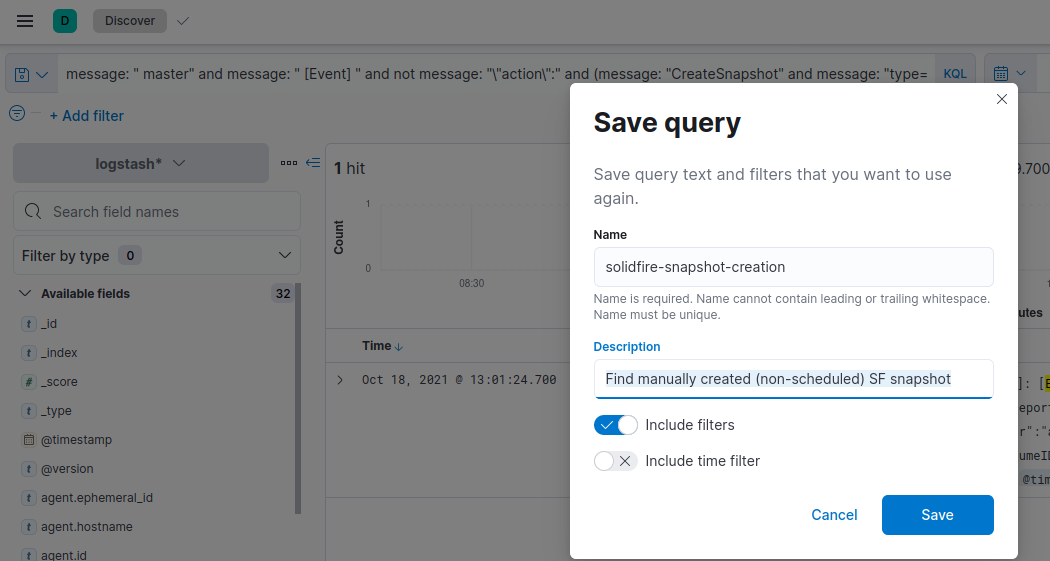
You can also examine SolidFire log on syslog server, just be careful with escape characters and wildcards because Kibana queries may require a different syntax:
cat /var/log/solidfire.log | grep "\[Event\]" | grep "elastic-snapshot"
The above would result in finding the same snapshot (line breaks are mine, to make it easier to see):
2021-10-18T05:01:23+00:00 192.168.1.33 master-1[5540]:
 [Event] 8970 PionScheduler serviceshared/EventReporter.cpp:582:ReportEvent
 |Successfully reported event={id=47307 type=ApiEventnodeID=1 message=
 [API Call (CreateSnapshot)] details=
 {"context":{"ip":"192.168.1.12","user":"admin"},
 "method":"CreateSnapshot","params":
 {"name":"elastic-snapshot","requestAPIVersion":"11.0","retention":"0:5:00","volumeID":484},
 "success":true}
 reported=2021-10-18T05:01:23.480432Z
 published=2021-10-18T05:01:23.480489Z}
 mNumEventsPublished=50
SolidFire node & cluster faults (Reporting > Alerts) are even easier to work with, because if we query for current (rather than all or resolved) faults, we won't have to do much filtering - if no faults are found, you won't get anything returned.
Status polling with http_poller (below) show how we can work with cluster faults using another ELK (Logstash, in this case) feature which results in structured data in Elasticsearch.
Status Polling with http_poller
Fed up with the log format challenges I examined http_poller plugin and hours later (just as I was also getting fed up with the Logstash documentation for the plugin), I made it work (see configuration and output samples in Appendix D).
I don't do any filtering - it's just in-and-out - but the responses are already structured well enough.
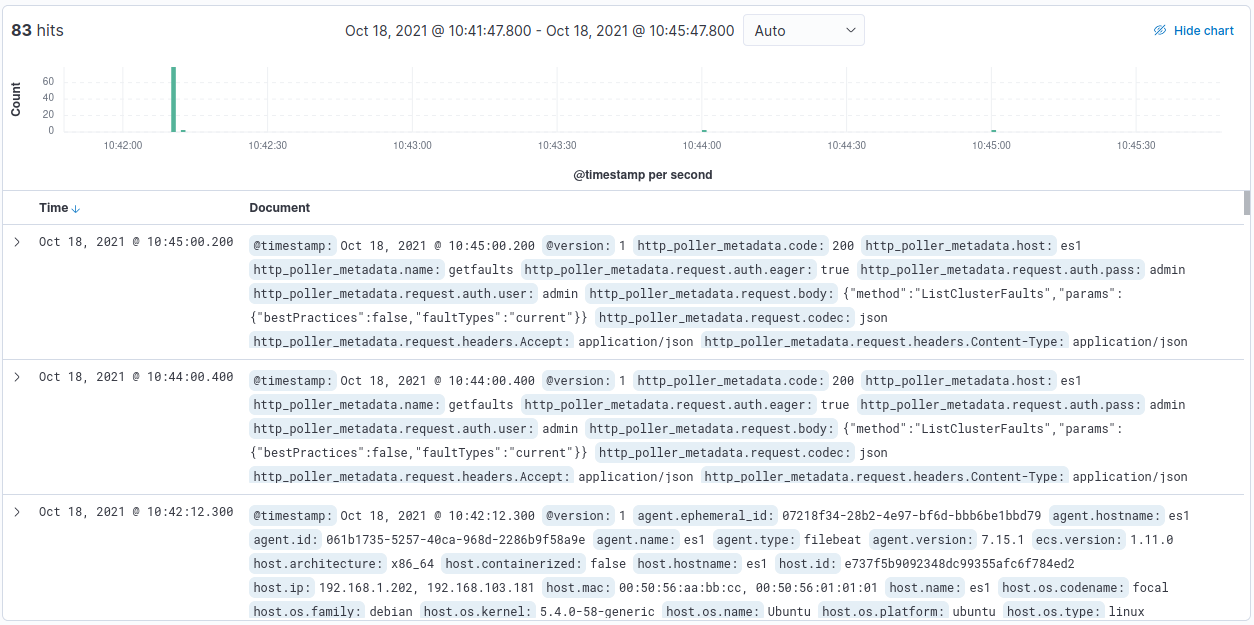
I don't know if you can make it out (in any case, you can see the contents in http-poller.conf in Appendix D), but we're using ListClusterFaults and the answer is there's two of them: (1) IOPS are overprovisioned, and (2) paired cluster is unreachable. (It's a SolidFire Demo VM whose replication peer VM has been shut down.)
Upon seeing this we should fix these issues. They'd become resolved and disappear. Until such time you can create a chart that shows fault count and perhaps group them by severity.
When I said about the well-defined structure, I meant that we can easily get contents of each fault (faults.code), severity (faults.severity), and other important details:
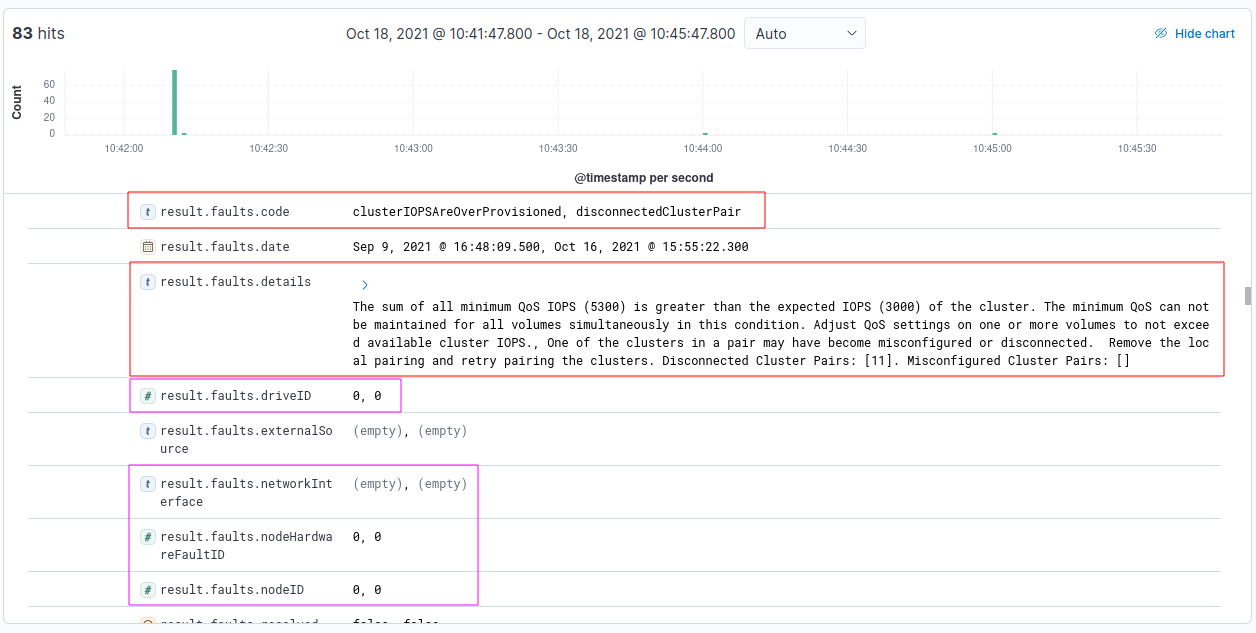
Don't forget that this is just one of the many easy-to-use SolidFire API methods. You could get cluster capacity, cluster efficiency, volume capacity and other details this way: just copy-paste the example I provide and change body contents (use Postman with SolidFire Postman Collection for prototyping).
Security-wise http_poller should use a read-only, monitoring-type cluster administrator account, because it needs to access the API (MVIP). Comparatively speaking log forwarding is safer and probably has a shorter lag (http_polller runs once a minute), but these trade-offs could be acceptable for most environments (in highly secure environments we could drive this traffic through a restful HTTPS proxy to ensure only allowed Get and List methods are used).
SNMP Trap Monitoring
I didn't have time to try this one, but it looks simple enough for fault and event monitoring.
http_poller seems easier, but SNMP Traps are usually more secure from access perspective (SNMP Traps are "push", and don't require inbound access to SolidFire cluster admin account and Management network).
To prepare SolidFire, you'd enable SNMP and send SNMP Fault Traps and Resolved Fault Traps to Logstash service. I wrote several posts on SolidFire v11/v12 and SNMP - go to Archive and find SNMP on the page.
Creating Charts and Visualizations
I'll show two examples, one with structured logs and another with http_poller logs.
Using configuration from Structured Logs example (where only SolidFire log messages in the JSON format are sent to Elastic), we pick an event such as CreateSnapshot:
sf_api.xClusterEvent.Data.method: "CreateSnapshot"
Kibana > Analytics > Dashboard takes us to a place where we can visualize this information. Notice I picked iso8601_timestamp (extracted with Grok filter) from SolidFire logs rather than just timestamp.

Knowing the number of snapshot creates isn't immensely useful, but you could watch something else (capacity, number of volumes, etc.) - just create a query that finds the information you need.
The second example uses http_poller with ListVolumeStats method. I created a donut chart that shows volumes' IDs and relative sizes.
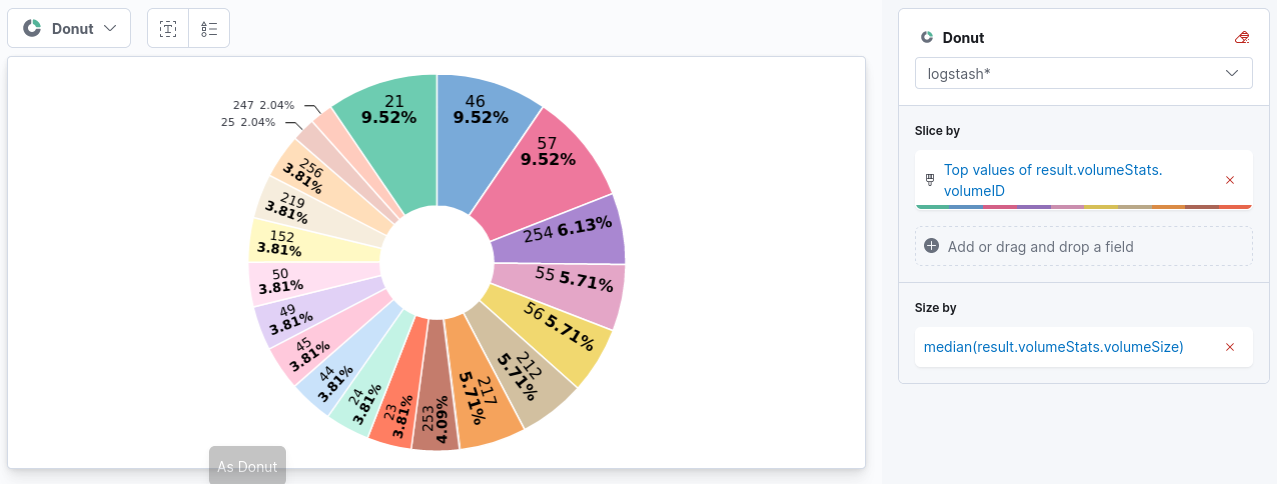
Notice I used volumeStats.volumeID and volumeStats.volumeSize. We'd change volumeStats.volumeSize to volumeStats.volumeIOPS or other field to visualize performance, or efficiency, or some other property.
Video Demo
Find it here (2m40s).
Conclusion
I've created several video demos of SolidFire log redirection to Elastic, Graylog, and Splunk, but I've never had a reason to dive deeper into this.
I still don't have all the answers, but I'd say this is close enough.
http_poller looks very promising, especially given how good the SolidFire API is.
Some ideas for next steps (when I find time):
- More advanced query examples
Performance monitoring(2021/10/19: added section with charts and visualizations)Develop additional examples with(2021/10/19: added performance monitoring example)http_poller
Kudos to whoever at Elastic came up with the idea to create a Dev/Test mode that doesn't force fascist security measures on people who just want to check some product functionality over the weekend.
Appendix A: Software Used
- NetApp SolidFire 11.7 (12 behaves the same)
- Self-signed CA & TLS certificate
- Ubuntu 20.04
- syslog-ng 3.25
- ELK Stack 7.15.1
Appendix B: Structured Log Monitoring Notes
- filebeat.yml: grep syslog for actions and include those you want (example below) and eliminate the [MS], [API], [Event] and other stuff
- type: filestream
  enabled: true
  paths:
    - /var/log/solidfire.log
  fields:
    logtype: sfapi
  include_lines: ['.*{"action":"ApiCall".*', '.*{"action":"Config".*', '.*{"action":"ConnectionState".*', '.*{"action":"Create".*', '.*{"action":"Event".*', '.*{"action":"Exit".*', '.*{"action":"Fault".*', '.*{"action":"Heartbeat".*', '.*{"action":"LoginResponse".*', '.*{"action":"PhyDrive".*', '.*{"action":"PhyNetwork".*', '.*{"action":"PhyNode".*', '.*{"action":"PhyNodeSensors".*', '.*{"action":"PhyNvram".*', '.*{"action":"Role".*']
- sf-pipe.conf used with Logstash:
input {
    beats {
        port => "5044"
    }
}
filter {
  grok {
    "match" => { "message" => '%{TIMESTAMP_ISO8601:iso8601_timestamp} %{IPV4} %{SYSLOGPROG:program}: %{GREEDYDATA:message}' }
    overwrite => [ "message" ]
 }
 json {
   source => "message"
   target => "sf_api"
 }
}
output {
  elasticsearch { hosts => ["192.168.1.202:9200"] }
  stdout { codec => rubydebug }
}
Appendix C: Unstructured Log Monitoring Notes
- Note that regular expressions in this section are not production-quality - on the contrary (in the case you can't tell)
[API]logs contain the contents of all SolidFire RestAPI calls. I haven't compared the contents of these lines vs. JSON-based logs, but it's possible that we could get everything we need from[API],[MS], and[Event]entries
2021-10-16T08:24:27+00:00 192.168.1.33 master-1[5540]: [API] 8980 PionScheduler httpserver/RestAPIServer.cpp:281:LogAndDispatch|RestAPI::CreateVolume SUCCESS result={"curve":{"1048576":15000,"131072":1950,"16384":270,"262144":3900,"32768":500,"4096":100,"524288":7600,"65536":1000,"8192":160},"volume":{"access":"readWrite","accountID":9,"attributes":{},"blockSize":4096,"createTime":"2021-10-16T08:24:27Z","currentProtectionScheme":"singleHelix","deleteTime":"","enable512e":true,"enableSnapMirrorReplication":false,"iqn":"iqn.2010-01.com.solidfire:72k4.elastic.473","lastAccessTime":null,"lastAccessTimeIO":null,"name":"elastic","previousProtectionScheme":null,"purgeTime":"","qos":{"burstIOPS":1000,"burstTime":60,"curve":{"1048576":15000,"131072":1950,"16384":270,"262144":3900,"32768":500,"4096":100,"524288":7600,"65536":1000,"8192":160},"maxIOPS":800,"minIOPS":300},"qosPolicyID":9,"scsiEUIDeviceID":"37326b34000001d9f47acc0100000000","scsiNAADeviceID":"6f47acc10000000037326b34000001d9","sliceCount":0,"status":"active","totalSize":2000683008,"virtualVolumeID":null,"volumeAccessGroups":[],"volumeConsistencyGroupUUID":"121812ca-4477-4382-b06c-1f4e1483b9a0","volumeID":473,"volumePairs":[],"volumeUUID":"5c854ba6-eeb7-4378-8f14-96c7839ca6a7"},"volumeID":473}
The above could be massaged to get the JSON part in the last group like this:
((20[2-9][0-9])-[0,1][0-9]-[0-2][0-9]T[0-9]{1,2}:[0-9]{1,2}:[0-9]{1,2}\+[0-2][0-9]:[0-9][0-9] [0-9]{1,3}.[0-9]{1,3}.[0-9]{1,3}.[0-9]{1,3} master-[0-9]{0,1}\[[0-9]+]: \[API\] [0-9]{1,6} PionScheduler httpserver\/RestAPIServer.cpp:[0-9]{1,5}:LogAndDispatch|RestAPI::[a-zA-Z]+ SUCCESS result=)({*.*})
- In the case of JSON-based logs, we could use regular expressions to extract the content of actual API call by looking under
xClusterApiCall. This may be easier to do with Logstash JSON decode filters, but in the case you use it elsewhere.
2021-10-17T02:59:35+00:00 192.168.1.33 master-1[5540]: {"action":"ApiCall","idg":"940460905823515","idx":76909,"system":"Cluster","utc":"2021-10-17T02:59:35.345599Z","ver":"1.1","xClusterApiCall":{"Method":"ListSyncJobs","SourceIP":"192.168.1.12","Threads":1,"Time":4,"Username":"admin"}}
Getting to nested JSON:
((20[2-9][0-9])-[0,1][0-9]-[0-2][0-9]T[0-9]{1,2}:[0-9]{1,2}:[0-9]{1,2}\+[0-2][0-9]:[0-9][0-9] [0-9]{1,3}.[0-9]{1,3}.[0-9]{1,3}.[0-9]{1,3} master-[0-9]{0,1}\[[0-9]+]:.*)({\"action\":\"ApiCall\".*\"xClusterApiCall\":)({.*})
- filebeat.yml for many-formats-one-log approach:
filebeat.inputs:
- type: filestream
  enabled: true
  paths:
    - /var/log/solidfire.log
  include_lines: ['.*{"action":"ApiCall".*', '.*{"action":"Config".*', '.*{"action":"ConnectionState".*', '.*{"action":"Create".*', '.*{"action":"Event".*', '.*{"action":"Exit".*', '.*{"action":"Fault".*', '.*{"action":"Heartbeat".*', '.*{"action":"LoginResponse".*', '.*{"action":"PhyDrive".*', '.*{"action":"PhyNetwork".*', '.*{"action":"PhyNode".*', '.*{"action":"PhyNodeSensors".*', '.*{"action":"PhyNvram".*', '.*{"action":"Role".*', '\[Event\] [[:digit:]]+', ' \[MS\] [[:digit:]]+ CFaultMon ', ' \[API\] [[:digit:]]+ PionScheduler httpserver/RestAPIServer']
filebeat.config.modules:
  path: ${path.config}/modules.d/*.yml
  reload.enabled: true
  reload.period: 10s
setup.template.settings:
  index.number_of_shards: 1
setup.kibana:
  host: "192.168.1.202:5601"
output.logstash:
  hosts: ["192.168.1.202:5044"]
processors:
  - add_host_metadata:
      when.not.contains.tags: forwarded
  - add_cloud_metadata: ~
  - add_docker_metadata: ~
  - add_kubernetes_metadata: ~
logging.level: debug
logging.selectors: ["beat"]
- Logstash with sf-pipeline.conf (running on the same node as Filebeat and Elasticsearch) for many-formats-one-log (unstructured) approach:
input {
    beats {
        port => "5044"
    }
}
output {
  elasticsearch { hosts => ["192.168.1.202:9200"] }
  stdout { codec => rubydebug }
}
Appendix D: http_polling Examples
- Configuration
- If your SolidFire uses the "default" TLS certificate,
http_pollerwon't work. You can use Postman to upload certificate with (see here) - You'd need to create and upload a new one. If you created a valid TLS certificate, that'll work; if you create a self-signed TLS certificate, you'll need a truststore
- See the Logstash documentation for the truststore steps; sadly there's no
--insecureor such to let us save time
- If your SolidFire uses the "default" TLS certificate,
- Upload your TLS certificate to SolidFire MVIP (no need to remove delimiters in PEM and key files, just
cattheir content, and paste the content of each between the appropriate double quotes):
{
    "method": "SetSSLCertificate",
    "params": {
    	"certificate": "<TLS Certificate>",
    	"privateKey": "<TLS Cert's Private Key>"
    },
    "id": 1
}
- http_poller.conf:
input {
  http_poller {
    urls => {
      getfaults => {
        method => POST
        user => "monitor"
        password => "p@ssword"
        body => '{"method":"ListClusterFaults","params":{"bestPractices":false,"faultTypes":"current"}}'
        codec => "json"
        url => "https://192.168.1.34/json-rpc/11.7"
        headers => {
          "Accept" => "application/json"
          "Content-Type" => "application/json"
        }
      }
    }
    truststore => "/etc/logstash/tls/downloaded_truststore.jks"
    truststore_password => "123456"
    request_timeout => 30
    schedule => { cron => "* * * * * UTC"}
    metadata_target => "http_poller_metadata"
  }
}
output {
  elasticsearch { hosts => ["192.168.1.202:9200"] }
  stdout { codec => rubydebug }
}
http_pollerin action:
{
"result" => {
        "faults" => [
            [0] {
                               "data" => nil,
                               "date" => "2021-09-09T08:48:09.561100Z",
                           "resolved" => false,
                       "resolvedDate" => "",
                           "severity" => "warning",
                               "type" => "cluster",
                      "blocksUpgrade" => false,
                           "driveIDs" => [],
                     "externalSource" => "",
                             "nodeID" => 0,
                "nodeHardwareFaultID" => 0,
                            "details" => "The sum of all minimum QoS IOPS (5300) is greater than the expected IOPS (3000) of the cluster. The minimum QoS can not be maintained for all volumes simultaneously in this condition. Adjust QoS settings on one or more volumes to not exceed available cluster IOPS.",
                            "driveID" => 0,
                   "networkInterface" => "",
                     "clusterFaultID" => 58,
                               "code" => "clusterIOPSAreOverProvisioned",
                          "serviceID" => 0
            },
            [1] {
                               "data" => nil,
                               "date" => "2021-10-16T07:55:22.368962Z",
                           "resolved" => false,
                       "resolvedDate" => "",
                           "severity" => "warning",
                               "type" => "cluster",
                      "blocksUpgrade" => true,
                           "driveIDs" => [],
                     "externalSource" => "",
                             "nodeID" => 0,
                "nodeHardwareFaultID" => 0,
                            "details" => "One of the clusters in a pair may have become misconfigured or disconnected.  Remove the local pairing and retry pairing the clusters. Disconnected Cluster Pairs: [11]. Misconfigured Cluster Pairs: []",
                            "driveID" => 0,
                   "networkInterface" => "",
                     "clusterFaultID" => 67,
                               "code" => "disconnectedClusterPair",
                          "serviceID" => 0
            }
        ]
    },
    "http_poller_metadata" => {
                    "name" => "getfaults",
        "response_headers" => {
                                        "date" => "Mon, 18 Oct 2021 01:07:00 GMT",
                                      "server" => "nginx",
                                "content-type" => "application/json",
                "access-control-allow-headers" => "DNT,X-CustomHeader,Keep-Alive,User-Agent,X-Requested-With,If-Modified-Since,Cache-Control,Content-Type,Authorization",
                                        "vary" => "Accept-Encoding",
                                  "connection" => "keep-alive",
                           "transfer-encoding" => "chunked",
                "access-control-allow-methods" => "GET, POST, OPTIONS",
            "access-control-allow-credentials" => "true"
        },
           "times_retried" => 0,
                 "request" => {
             "method" => "post",
              "codec" => "json",
               "body" => "{\"method\":\"ListClusterFaults\",\"params\":{\"bestPractices\":false,\"faultTypes\":\"current\"}}",
                "url" => "https://192.168.1.34/json-rpc/11.7",
            "headers" => {
                      "Accept" => "application/json",
                "Content-Type" => "application/json"
            },
               "auth" => {
                 "user" => "admin",
                 "pass" => "admin",
                "eager" => true
            }
        },
        "response_message" => "OK",
                    "code" => 200,
                    "host" => "es1",
         "runtime_seconds" => 0.423885
    },
                      "id" => nil,
              "@timestamp" => 2021-10-18T01:07:00.764Z,
                "@version" => "1"
}
- http_poller for volume capacity and performance statistics:
input {
  http_poller {
    urls => {
      getfaults => {
        method => POST
        user => "monitor"
        password => "p@ssw0rd"
        body => '{"method":"ListVolumeStats"}'
        codec => "json"
        url => "https://192.168.1.34/json-rpc/11.7"
        headers => {
          "Accept" => "application/json"
          "Content-Type" => "application/json"
        }
      }
    }
    truststore => "/etc/logstash/tls/downloaded_truststore.jks"
    truststore_password => "123456"
    request_timeout => 30
    schedule => { cron => "* * * * * UTC"}
    metadata_target => "http_poller_metadata"
  }
}
filter {
  split {
    field => "[result][volumeStats]"
  }
}