Gathering and forwarding E-Series SANtricity Major Event Log (MEL)
E-Series Performance Analyzer (EPA) v3.0.0 collects MEL (Major Event Log) events and send them to InfluxDB. I think SANtricity syslog events have similar information but I haven't yet observed them in that context.
MEL (Major Event Log)
To get MEL events from the SANtricity API we query the API:
curl -X GET \
  "https://${API_IP}:8443/devmgr/v2/storage-systems/${SYSID}/mel-events?startSequenceNumber=-1&count=100&critical=false&includeDebug=false" \
  -H  "accept: application/json"
Where:
- startSequenceNumber -
-1from the beginning - count - number of events (max = 8192)
- critical - include critical only
- includeDebug - include debug info
EPA v3.0.0 gathers MEL information the same way.
In E-Series Performance Analyzer MEL collection is also enabled by default and sent to console with --showMELMetrics. MEL details - if any - are displayed in a table in System View Dashboard (EPA v3.0.0):
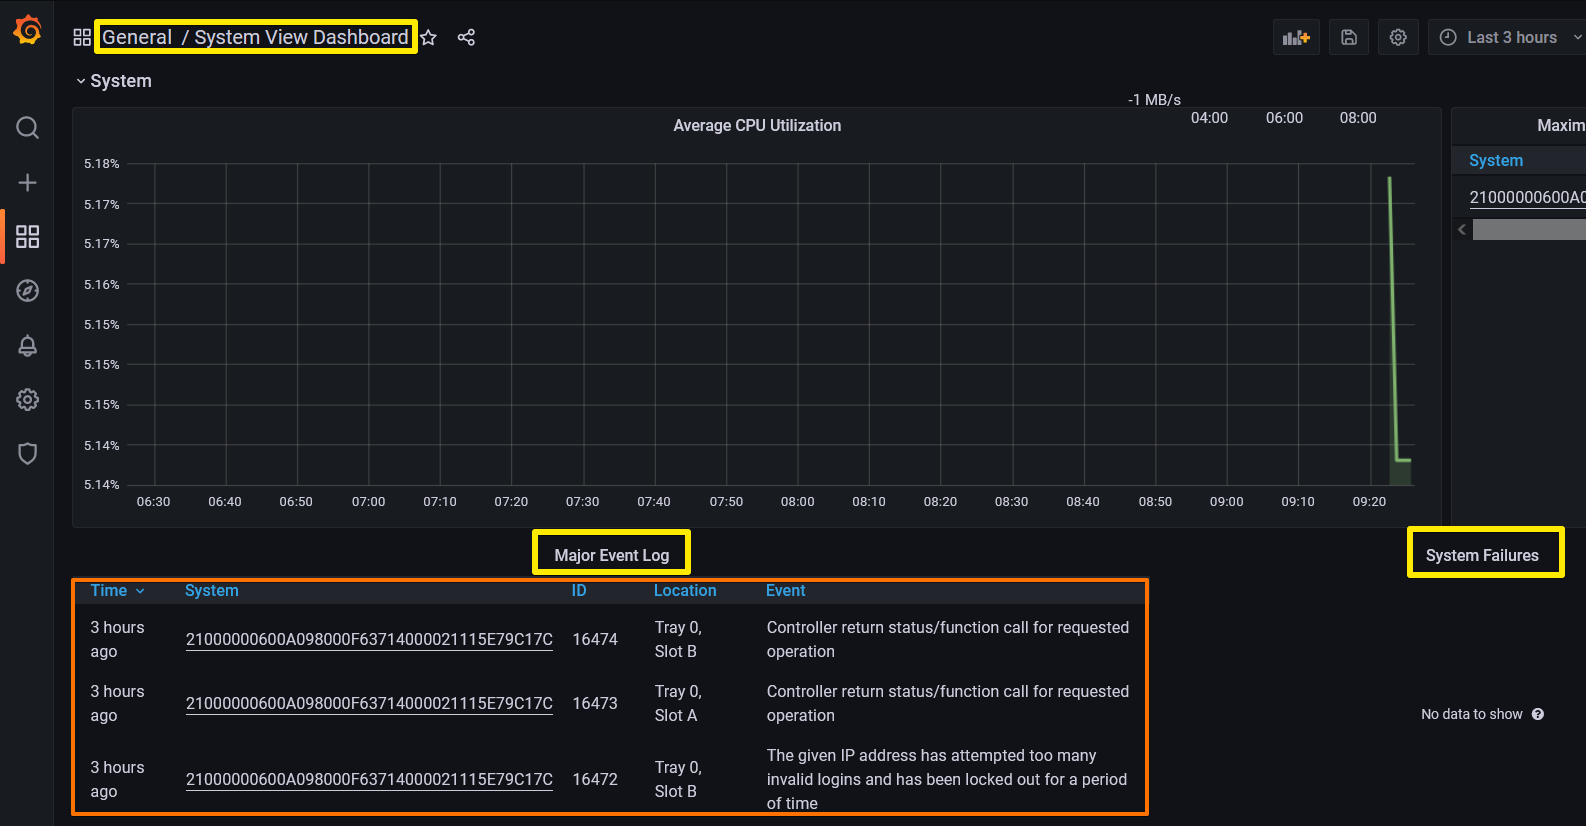
The System Failures table (to the right) is currently empty. If the MPIO failure mentioned earlier was present but unresolved, it would be shown in that table.
MEL table in the screenshot contains non-critical events, including Link Down events and multiple failed attempts to authenticate against the SANtricity API or Web UI which resulted in a lockout (600 seconds with SANtricity 11.74). (Funny fact: if this (wrong password provided in docker-compose.yml) happens to EPA's collector script, you won't see this chart because nothing will be sent to Influx DB or visible in Grafana.)
The EPA's System dashboard doesn't let us search MEL events.
For that and other reasons it would be better to send MEL data to an indexed document database such as Elasticsearch. EPA v3.0.0 supports only InfluxDB v1 but Elasticsearch supports syslog, so the easiest alternative to gathering MEL data without writing new code or modifying EPA is to forward SANtricity logs to a syslog server.
The second easiest option is to improve EPA and optionally send MEL to Elasticsearch instead, or also to Elasticsearch (in addition to InfluxDB v1).
Failures
Failure Discovered / Failure Resolved entries are different from MEL. The Systems dashboard has controls which can display discovered, resolved, or both types of failures.
This screenshot shows an MPIO-related failure.
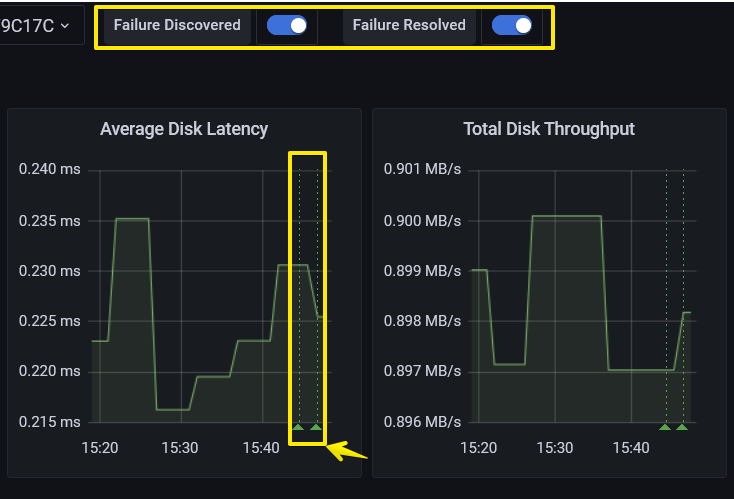
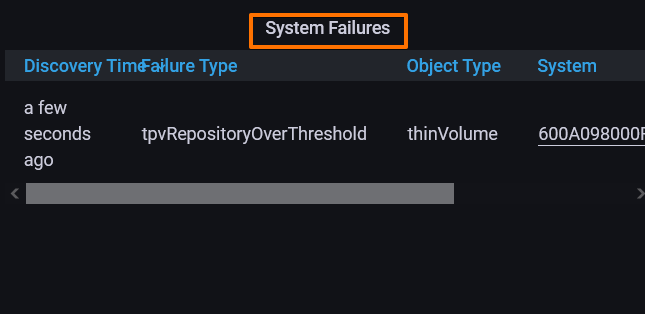
Edit: later I tested some other things and confirmed additional behavior of this feature. System failures such as this one appear in the System Failures table:
They're also overlaid on charts (red line).
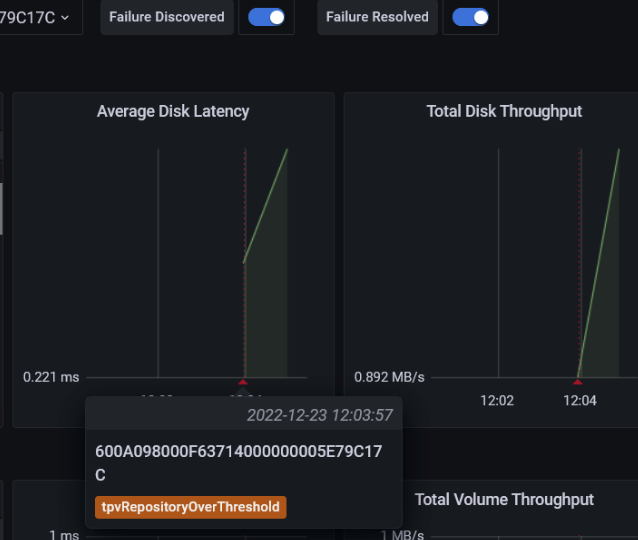
Failures resolved are overlaid as well (green line).
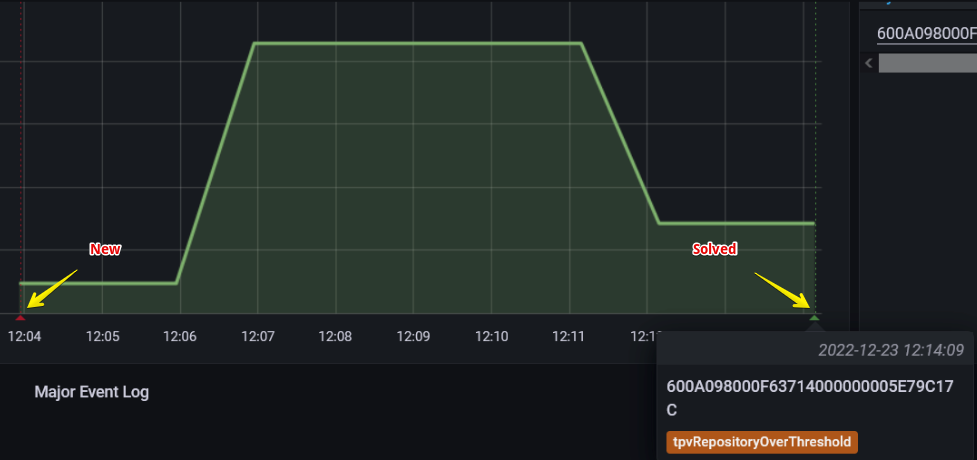
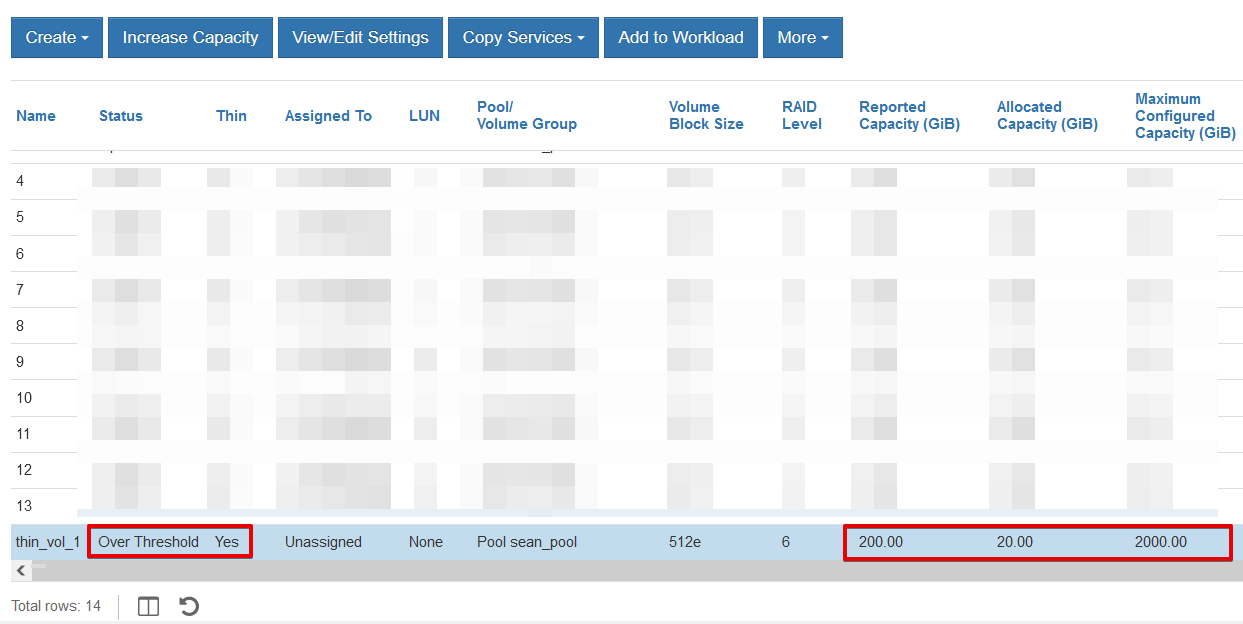
What was the problem that caused it? I used the SANtricity API to create a very thin volume.
Summary
- Failures:
/devmgr/v2/storage-systems/{system-id}/failuresand EPA v3.0.0 tags these withfailures - MEL:
/devmgr/v2/storage-systems/{system-id}/mel-eventsand EPA v3.0.0 tags these withmajor_event_log- New MEL events:
/devmgr/v2/storage-systems/{system-id}/mel-events/available
- New MEL events: