E-Series SANtricity Collector (ESC 4)
Introduction
It's been a while since I posted EPA 4 beta - almost eight weeks by now.
As usual, I've received a ton of feedback (zilch) from our fanatical Open Source community, so time has come to simply tag that last beta commit and release.
Well, not really. What happpened is I made multiple overhauls and now finally it looks okay, so I no longer consider it "beta" quality.
In this post I'll make some additional notes about this release without re-hashing what you can read in the EPA 4 beta post linked above.
Why the new name (ESC)?
I explain that in the README in the new repository, but I'd like to have that here, too.
Because there are some pretty unbelievable facts about Github forks:
- Your fork may never be findable on Github
- Your fork is less likely to ever get indexed by a search engine
Let that sink in…
Would you use such a site for a community project?
I always knew my EPA 3 fork wasn't anywhere near the top in search engine rankings for this topic (of E-Series performance monitoring), but as I was getting closer to completing EPA 4, I took a closer look and realized EPA 3 wasn't just ranked poorly - it was not indexed at all.
The other day I searched for E-Series performance analysis and such on Github. The archived (dead) NetApp repository I forked EPA 3 from was ranked first. My actively maintained fork of several years wasn't listed at all.
Good luck with your project!

I can understand why they destroy discoverability of forks, but I don't have to like it. It sucks.
What I did last week:
- I unliked EPA 3 from the NetApp EPA so it's no longer a "fork" - a stupid "fix" that is unlikely to make things worse since AI wasn't listed or discoverable on any search engine
- I published EPA 4 in a new repository called ESC - just in case this nonsense with forks doesn't improve even after unliking the EPA 3 repository from the NetApp EPA 3 archive
Besides, ESC is much more focused on configuration than performance (which is collected to the same extent EPA 3 collects it), so it deserves its own repository.
Is EPA 3 dead?
No.
Because EPA 3 is simple compared to ESC (EPA 4), by publishing ESC to the EPA repository I'd probably have to ask users to gradually switch to version 4. But because these are different applications, I think having EPA 4 as "E-Series SANtricity Collector" in its own repository is better for E-Series users.
I'll try to maintain both EPA 3 and ESC.
As I mention in the ESC README, the extent to which one can maintain or fix ESC without access to a variety of hardware configurations is very limited since ESC is focused on precisely that (configuration) and I normally have no access to hardware. So EPA 3 will remain a relatively low risk choice for users interested in performance monitoring of E-Series storage arrays.
And who knows, maybe after this unlinking from the upstream, EPA 3 becomes discoverable one day!
What's in ESC
As mentioned above and the EPA 4 Beta post - a lot more configuration collection, better security, and AI/analytics readiness.
Since late August I realized InfluxDB doesn't consume much space, so I've removed S3 service from the image (although it can be added if anyone wants it), and what we have in the ESC stack is:
- E-Series SANtricity Collector
- InfluxDB 3
- InfluxDB 3 Explorer (UI)
- Grafana 12 (no dashboards, but maybe I'll add some later)
- Utilities container (CLI for InfluxDB, mostly)
- Reverse HTTPS proxy (to protect everything with TLS v1.3 and PQC)
- InfluxDB MCP server (for experimentation, although actual deployment would be on the client)

It takes about 1 minute to set up and compared to your average small-time OSS monitoring stack, I'd say this one is done and documented reasonably well.
Where is ESC in terms of PQC?
I put that in the README as well, but without much detail. Some extra detail:
- NGINX doesn't have it yet because current version 1.29.1 was built against an older OpenSSL
- Latest OpenSSL 3.6.0 just released ML-KEM support mere days ago
- ESC's Proxy service's config files are ready and once NGINX is built against that newer version of OpenSSL, we'll update
.envto latest NGINX, remove the#from lines withssl_ecdh_curve X25519MLKEM768in ournginx.conf.tpl, rundocker compose up --build proxyand that should be it - I built and tested NGINX with latest OpenSSL (when it was still in beta) and it worked. Anyone who wants to build on his own can do this today.
The nice thing about built-in security by default is we don't have to wait until all services start supporting PQC. The proxy service protects all of them.
This also makes it easy to shield E-Series controlles behind the same proxy and get PQC for those HTTPS connections, too. I haven't built that into the stack because there may not be anyone who needs that, but it's easy to do. The challenge is one would need valid certificates and people who need that leel of security probably don't run "random" Github code in any case.
Measurements (or "tables")
Here's what ESC 4 collects:
config_controller
config_drives
config_ethernet_interface
config_host_groups
config_hosts
config_interfaces
config_snapshot_groups
config_snapshot_schedules
config_snapshots
config_storage_pools
config_system
config_volume_mappings
config_volumes
env_power
env_temperature
events_lockdown_status
events_system_failures
performance_controller_statistics
performance_drive_statistics
performance_interface_statistics
performance_system_statistics
performance_volume_statistics
All the performance stuff from EPA is there, plus a lot more for analytics and AI. One configuration detail I hoped to collect was Flash Cache, but I couldn't as the hardware didn't have the feature enabled.
And notably, I dropped MEL collection from ESC. Logs shouldn't be collected by a performance and configuration collector. Afuera!
I've had people ask me what do all the fields in these measurements mean. Who the hell knows? I just collect and store them!
In some cases you can tell by the nam, but don't expect me to write any documentation for that when the official SANtricity documentation doesn't have these details.
But many (>95%?) are not hard to guess. Most are very obvious.
As soon as you deploy - especially if you have multiple E-Series arrays - there's low-hanging fruit:
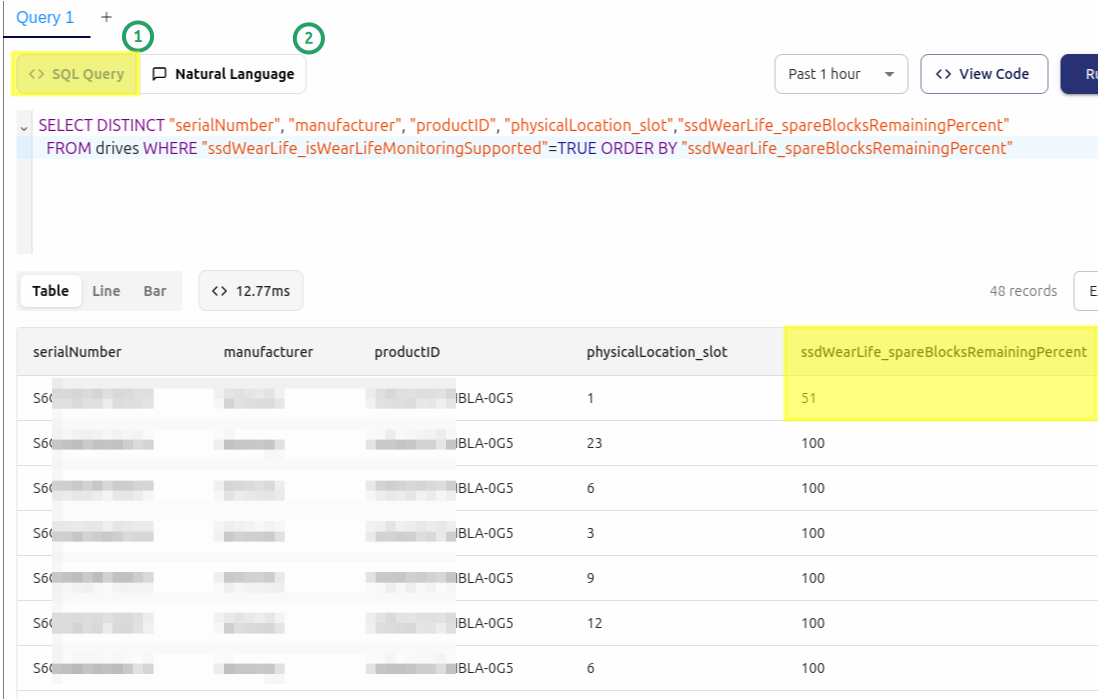
- Use SQL queries to find components with problems (SSDs with high disk wear, interfaces with errors, volumes on non-preferred controllers)
- If you have an API key for any of major AIs, you can have those queries made for you by simply asking a question ("Find me all volumes currently active on a non-preferred controller")
Which one to use?
The ESC README has a comparison table, but if you want simple and reasonably reliable monitoring, use EPA 3.
If you have developer skills or can gain from analytics/AI, take a look at ESC (EPA 4). I say "developer skills" because you may need to fix something non-trivial that's a problem only in your specific hardware environment. Or you may upgrade InfluxDB to 3.6.0 from 3.5.0 and notice something no longer works… Gains from analytics/AI may be possible if you monitor several systems.
The SANtricity API is relatively dormant, but it seems (I didn't keep detailed notes) they sometimes make undocumented minor changes. That can break certain measurements, but I don't have any plan to chase those. I'll generally support recent versions on hardware I have access to.
ESC is complicated and has a bunch of stuff in the stack. This is just Collector:
$ wc -l ./collector/**/*.{py,sh} | grep total
 17202 total
Other thoughts
I spent a lot more time on this (with a 2-week "hole" in August due to making EPA 3 updates and bug fixes) because I kept mission-creeping. Among my larger (but still not large) apps Firemox is big - it has several thousand lines of code - and this was several times bigger. And complexity doesn't grow linearly.
I also wanted to prove that the amount of resources required to provide a decent monitoring and analytics stack for E-Series is not significant. It's just a decision. An amateur managed to do it in his spare time.
About mission-creeping:
- Collection from JSON works well. I had to scope down to "one system at a time" (as opposed to any number of systems), but even that is awesome once you see it in action. Collection to JSON also works well
- Prometheus exporter isn't well-tested, but it seems fine
- Metrics enrichment isn't perfect (I made some design mistakes and discovered them too late), so it requires extra work on the SQL or Grafana side, but it doesn't make that work impossible
- Stack configuration does have more than 10 steps, but the stack is much thicker than it is in EPA 3. I was thinking if I should choose more detailed documentation or EPA 3-style "Makefile" (which I finally got rid of in a recent update). I decided to go with more documentation as I can't believe that more people would rather read a Makefile than documentation
Next steps
This toy is ready and it'd be nice to spend some time using this software, but I have to move onto next (overdue) TODO's related to SolidFire.
I have some ideas for AI-driven analytics, MCP and more that I'd like to explore with ESC. Although I don't have meaningful workloads to showcase ESC with real-life environments, I'd like to publish a few posts exploring the possible with this stack.
ESC and that stack needs to be used and evaluated to see what can be done with it more than it needs more configuration measurements. I know exactly what's missing (a lot), but if one doesn't have a use case for it, there's no point of adding it to the application.
My EPA 3 stack will be updated and tested with latest and greatest InfluxDB v1 (yes, it's still maintained!) and maybe I'll add a minor new feature or two, so that's currently my first priority for future E-Series contributions.