New EPA 4.1 and Victoria Logs S3 tiering feature
EPA (E-Series Performance Analyzer) 4.1.0
EPA 4.1.0 gathers selected additional or new metrics from SANtricity 12.1, related to NVMe, RoCE, and host performance. I didn't put them in Grafana because the figures look funny. In SANtricity UI (host-facing network throughput):
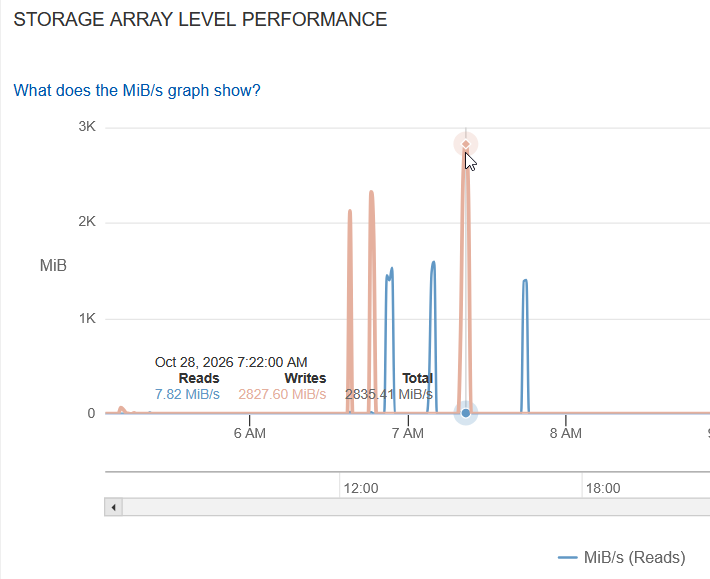
While I get this from RDMA-only host-side traffic monitor (and I don't have other clients than NVMe/RoCE):
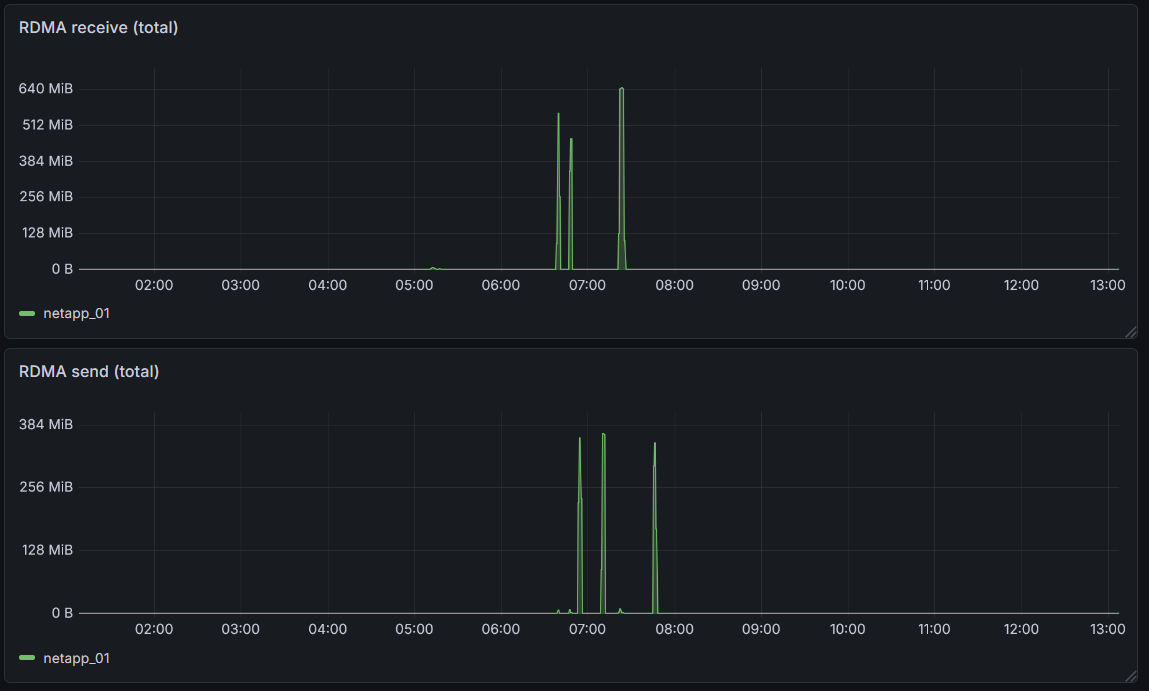
sum by(sys_name) (rate(eseries_rdma_receive_bytes_total{sys_name="netapp_01"}[$__rate_interval]))
sum by(sys_name) (rate(eseries_rdma_transmit_bytes_total{sys_name="netapp_01"}[$__rate_interval]))
Even if I add these up, the peaks don't overlap so I still fall short by a lot. Maybe that's because averaging doesn't happen at the same time or the same way, so they're "out of sync", so to speak.
Directionally, it looks fine. But it doesn't look reliable and I don't know what the throughput really was. I'll have to find time to figure this out.
Host performance figures are also "analyzed" i.e. averaged over minutes by the time we get them, but that's better than not having them at all.
They let the storage administrator see how clients are doing performance-wise, which can help them with planning and troubleshooting.
It also fixes some annoying Grafana query bugs which turned correct data into wrong information.
- For physical disks (not volumes or controllers), throughput in MB/s was wrong in Grafana.
- For physical disks, I/O latency figures were also wrong in Grafana.
- There is a fix for another Grafana bug that appeared due to the misleading Prometheus metric name (I gave it a bad name in Prometheus exporter, and did the right thing based on the misleading meaning/name, which result in incorrect Grafana metric).
- There were various minor updates including Python dependencies, SANtricity client library, and Grafana.
I spotted the Grafana bugs last month, as I had a chance to use EPA 4 with NL-SAS arrays, where the bugs were easy to spot (due to it, the latency figures Grafana was showing were fakely high). The bug summed up, instead of averaged, disk latency, so with SSD arrays that were not under stress, it was hard to see anything unusual, while the Prometheus metrics were correct…
That's what happens in one-person projects. I don't think more than five people use EPA, but I like EPA and it works the way I want.
EPA 4 still has less than 5,000 lines of code. The EPA 3 bloat that was present when I forked it from upstream has been eliminated. EPA can still run from the CLI and as systemd service (this was added after I forked it) and needs very little resources in general. I can be understood and edited by users.
There are just two direct dependencies: requests and Prometheus. When you update OS or container, Python (and likely requests) get updated with it. Prometheus exporter shares data from a read only Web site. Because of that, there are few issues and CVEs.
If you look at some other monitoring projects, you may notice they have over 200,000 lines of code. And they keep adding logging and event features. EPA, on the other hand, kicked those out in 4.0; in my view, getting rid of those things was a feature. It also significantly reduced the amount of RAM required by Collector.
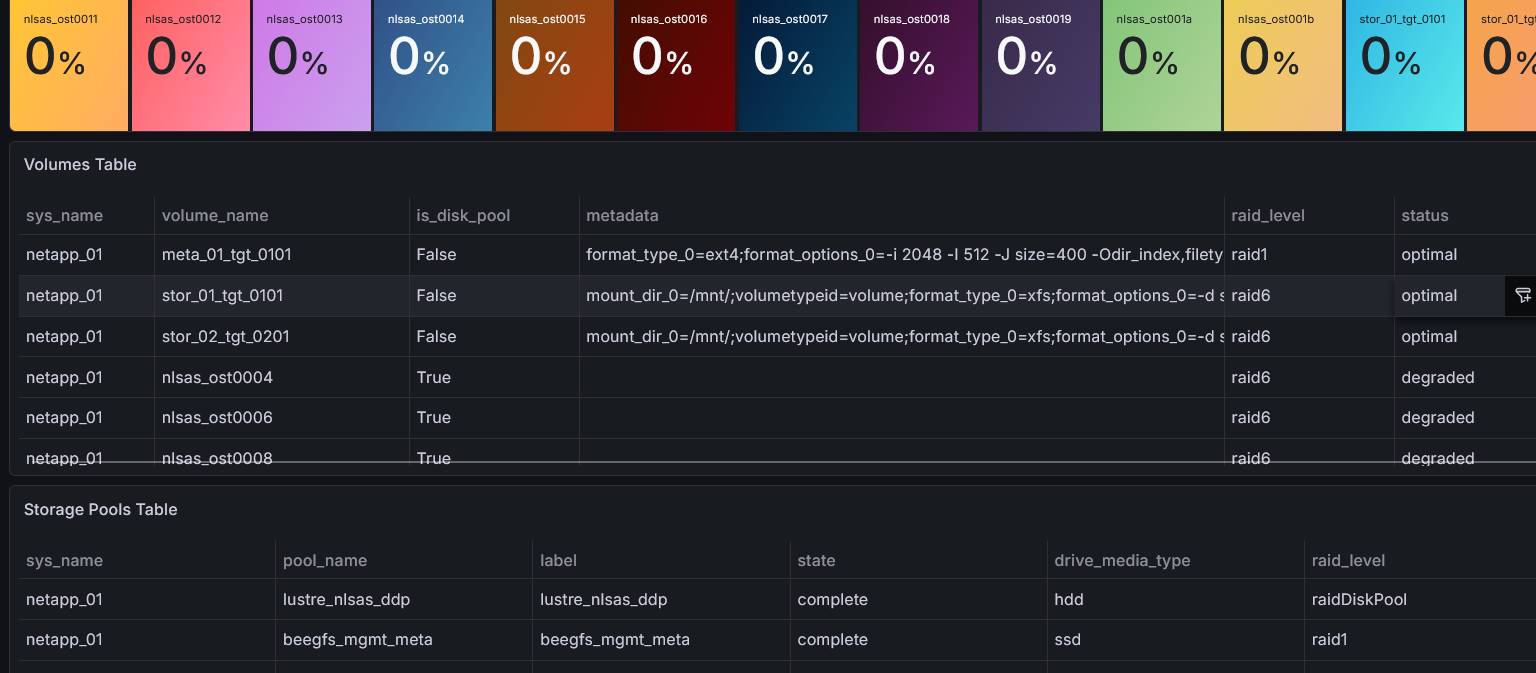
By the way, some time ago I added volume metadata collection so that I can view Kubernetes (PVC) metadata injected by SANtricity CSI in EPA. Last week, I accidentally stumbled across some LUNs created by NetApp's Ansible playbooks, which also set volume metadata. Those can be viewed as well. Good to know.
Logging
Victoria Logs is recommended for logs and alerts, especially if you're one of few EPA 3 users and miss some of the events/MEL stuff removed from EPA 4.
Victoria Logs' S3 offload feature
Victoria Logs compresses data very well, but still needs disk space.
Next month, they're expected to release S3 offload feature. It looks similar to searchable S3 snapshots in Elasticsearch. The initial implementation will have a rigid setting and behavior where daily partition data older than N days are moved to S3, and can be queried off S3.
offload.destination- point at S3 bucketoffloadPeriod- set to number of days to retain data on Hot Tier
Partitions moved to S3 become immutable and main tiering parameters are fixed. They'll likely improve those later, but if you have a complex environment, it may be better to give it some time to improve.
For on-premises storage, Versity S3 Gateway 1.9.0 should be compatible with this, but we also need to check if Victoria Logs tiers all partitions in one flat path (which wouldn't be good for Versity S3 Gateway).
Practical S3 offload matters
A preview of the S3-tiering VL can be obtained from Docker Hub: docker pull victoriametrics/victoria-logs:heads-object-storage-0-g008977236.
We run this VL build with:
- Environment or args that pass AWS S3 keys to it
- S3 endpoint, region and other details (for StorageGRID or Versity S3 Gateway (perfect if you have it attached to E-Series E4000 or Hybrid EF-Series with DDP or RAID 6))
$ docker run --rm -p 9428:9428 \
  -v "$PWD/victoria-logs-data:/var/lib/victoria-logs" \
  -e AWS_ACCESS_KEY_ID=<brandon> \
  -e AWS_SECRET_ACCESS_KEY=<blah-blah> \
  -e AWS_REGION=us-east-1 \
  victoriametrics/victoria-logs:heads-object-storage-0-g008977236 \
  -storageDataPath=/var/lib/victoria-logs \
  -offload.cache.path=/var/lib/victoria-logs/cache \
  -retentionPeriod=180d \
  -offloadPeriod=30d \
  -offload.destination='s3://victoria-logs/' \
  -offload.s3.endpoint='http://192.168.1.194:7070' \
  -offload.s3.region='us-east-1' \
  -offload.s3.forcePathStyle \
  ...
... denotes the rest of your configuration options. I actually used an offload period of 1d so that I don't have to wait too long (remember that in the initial implementation you can't change this later, so don't try random stuff in production if you use this feature).
What happens once partitions have events that are over 30d (in my test case it's 1d) old, VL moves them to Versity S3 Gateway (in this case).
They're already space-efficient and initial implementation is rigid so there's nothing else you need to (or can) do.
I used my StorageGRID and SGAC converter output to test:
- Full raw S3 log (audit and access from StorageGRID 12)
- Two SGAC logs derived from the raw StorageGRID log above:
- Audit (
AUDTentries from StorageGRID's S3 API, both management and data) - Access logs (HTTP logs from StorageGRID 12 Load Balancer)
- Audit (
$ ll /var/log/s3.log
-rw-r----- 1 syslog adm 490809880 Oct 26 16:12 /var/log/s3.log

$ ll ./sgac/
-rw-rw-r-- 1 sean sean 176888273 Oct 26 15:50 sg-audit-2026-10-26.jsonl
-rw-rw-r-- 1 sean sean 299536114 Oct 26 15:50 sg-endpoint-2026-10-26.jsonl
490, 176 and 299 MB respectively. The second and third are basically copies of the first, with the syslog wrapper and other junk stripped.
VL data directory before tiering to S3:
$ du -sh ./victoria-logs-data/
173M    ./victoria-logs-data/

$ mc ls s2s3/victoria-logs
# nada, zippo, zilch, nuthin'
Good, Victoria Logs gives me 3:1 efficiency (173/490 - 65% savings and that's without "cheating" with the partially duplicate data from SGAC audit and access logs).
I tried several queries while the logs are still on local disk: up to 40ms (from query to result on host, not VL's own query).
What happens next:
- VL checks for partitions that slip beyond
offloadPeriodand moves data to S3 - Since I ingested months of these logs at once and VL hopefully recognized events' timestamp fields, it should move records older than 30d to that Versity S3 bucket after next check
Tiering happened exactly when it was supposed to happen: see the last (writ) column for VL's S3 PUTs:
----system---- ----total-usage---- -net/total- -dsk/total-
     time     |usr sys idl wai stl| recv  send| read  writ
26-10 08:34:36|  0   0  99   0   0|  54B  338B|   0  4095B
...
26-10 08:34:44|  1   3  94   2   0|  54B  338B|   0    11M
...
26-10 08:34:49|  2   3  89   2   0|  54B  346B|   0    19M
...
26-10 08:34:50|  2   3  93   1   0| 114B  354B|   0    19M
...
26-10 08:34:55|  1   3  91   2   0|  54B  346B|   0    11M
...
26-10 08:35:00|  1   2  93   2   0|  54B  338B|   0    22M
...
26-10 08:35:05|  1   2  96   1   0|  54B  338B|   0    30M
VGW logs show fast PUTs:
08:34:32 | vgw | 200 |     294.647µs | 192.168.1.13 | PUT | /victoria-logs/partitions/20261024/partition.ready | - | x-id=PutObject
08:34:32 | vgw | 200 |     203.965µs | 192.168.1.13 | HEAD | /victoria-logs/partitions/20261024/partition.ready | - |
08:34:32 | vgw | 200 |     302.088µs | 192.168.1.13 | GET | /victoria-logs | - | list-type=2&prefix=partitions%2F20261024%2Findexdb%2F
08:34:32 | vgw | 206 |     211.905µs | 192.168.1.13 | GET | /victoria-logs/partitions/20261024/indexdb/parts.json | - | partNumber=1&x-id=GetObject
08:34:32 | vgw | 206 |     168.494µs | 192.168.1.13 | GET | /victoria-logs/partitions/20261024/indexdb/18E20499E54ADEA3/metadata.json | - | partNumber=1&x-id=GetObject
08:34:32 | vgw | 206 |     176.254µs | 192.168.1.13 | GET | /victoria-logs/partitions/20261024/indexdb/18E20499E54ADEA3/metaindex.bin | - | x-id=GetObject
08:34:32 | vgw | 200 |     540.763µs | 192.168.1.13 | GET | /victoria-logs | - | list-type=2&prefix=partitions%2F20261024%2Fdatadb%2F
VL local disk:
$ du -sh ./victoria-logs-data/
8.6M    ./victoria-logs-data/
VGW bucket for VL:
$ mc du s2s3/victoria-logs/
96MiB   12124 objects   victoria-logs
Best of all, the VGW (object store) showed just one 26 MB egress:
$ dstat -tcnd
----system---- ----total-usage---- -net/total- -dsk/total-
     time     |usr sys idl wai stl| recv  send| read  writ
26-10 08:41:04|                   |           |
26-10 08:41:05|  0   0  99   0   0|4462B 5082B|   0  4095B
26-10 08:41:06|  0   0  99   0   0|1098B 1256B|   0    12k
26-10 08:41:07|  0   0 100   0   0|  54B  266B|   0     0
26-10 08:41:08|  0   0 100   0   0|  54B  258B|   0     0
26-10 08:41:09|  0   0  99   0   0|  54B  258B|   0     0
26-10 08:41:10|  0   0 100   0   0|  54B  258B|   0     0
26-10 08:41:11|  1   0 100   0   0|  54B  258B|   0     0
26-10 08:41:12|  0   0  98   0   0|  54B  258B|   0    16k
26-10 08:41:13|  5   3  93   0   1| 319k  305k|   0     0
26-10 08:41:14| 15   9  74   0   0|1112k   26M|   0     0
26-10 08:41:15|  2   1  97   0   0|  82k  355k|   0     0
26-10 08:41:16|  1   0  99   0   1|  54B  266B|   0     0
26-10 08:41:17|  0   0 100   0   0| 108B  348B|   0  4096B
26-10 08:41:18|  0   0  99   1   0|  54B  266B|   0  2676k
26-10 08:41:19|  0   0 100   0   0|  54B  266B|   0     0
26-10 08:41:20|  0   0  99   0   0|  54B  258B|   0     0
It's even better than it looks:
- Query times went up just to no longer than 1ms. The reason is mostly VGW data was also on NVMe, but the point is the feature overhead is not that significant. Media and protocol overheads might be, but you have cache and you don't have to tier too aggressively. If VGW was on NL-SAS, non-cached queries would surely be slower, but also 15x cheaper (based on recent SSD vs NL-SAS prices).
dstatoutput above shows not three, but six queries (two sets of 3 queries). The first (26-10 08:41:14) made VGW send 26 MB to VL, but the second (repeated) set of queries did nothing, because ofoffload.cache.path.
VL Hot Tier and S3 cache are up from 8 to 56 MB now. We don't have to do anything about this - it just works!
$ du -sh victoria-logs-data/
56M     victoria-logs-data/
S3 data remains until retentionPeriod is reached when it's gradually pruned in whole UTC-day partitions.
How does a cold VL day look like on S3?
partitions/20260615/datadb/18E204973B1495FC/bloom.bin0
partitions/20260615/datadb/18E204973B1495FC/metadata.json
partitions/20260615/datadb/18E204973B1495FC/timestamps.bin
partitions/20260615/partition.ready
My main concern was too many objects per directory level on filesystem. VL applies date prefixes, so that is not a problem.
In my lab, I didn't have activity on some days which resulted in 0-sized objects (bloom.bin<int>), but that's not a problem either.
Three objects per date prefix is very nice! Even if we keep 3 years on S3, it's still just barely 1.1K subdirectories on XFS.
$ mc ls s2s3/victoria-logs/partitions/
[2026-10-26 17:36:51 CST]     0B 20260615/
[2026-10-26 17:36:51 CST]     0B 20260616/
[2026-10-26 17:36:51 CST]     0B 20260617/
[2026-10-26 17:36:51 CST]     0B 20260618/
[2026-10-26 17:36:51 CST]     0B 20260619/
[2026-10-26 17:36:51 CST]     0B 20260620/
...
From the above, we can conclude these are all valid options.
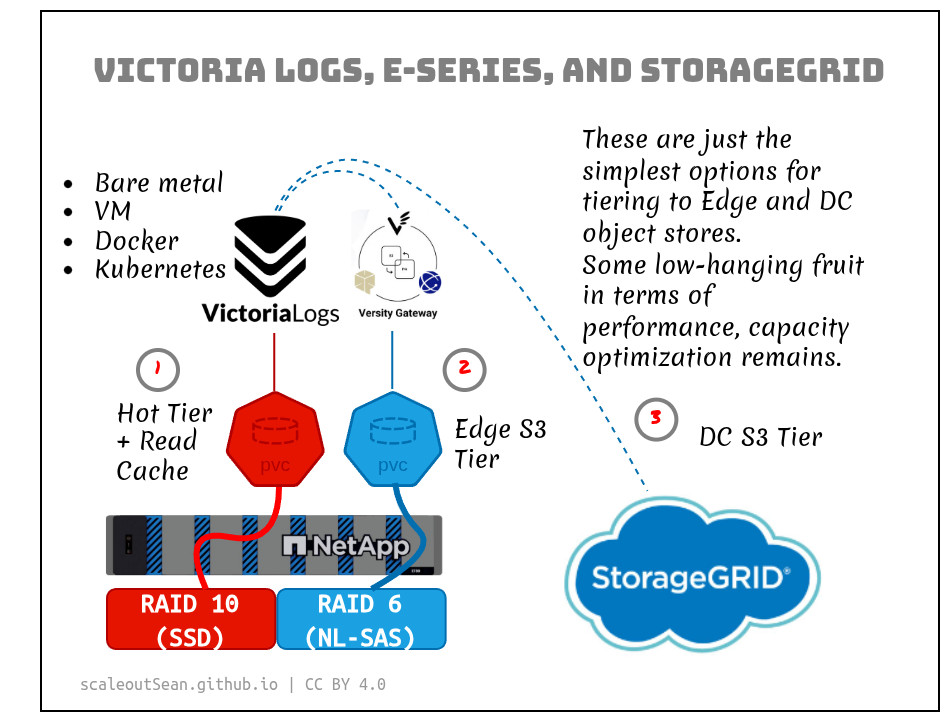
Other options for juggling SSDs and HDDs include SANtricty- or host-side-cache, each with different trade-offs. bcache actually caused problems to SANtricity CSI, so if you try that path it's fine - just don't try it on Kubernetes.
SANtricity 12
EPA is the simplest and most lightweight performance metrics exporter for SANtricity 12 and follows the Unix philosophy:
a set of cultural norms and philosophical approaches to minimalist, modular software development.
Kicking events and logs out of it was a great decision and Victoria Logs is recommended for those who miss that feature from EPA 3. Victoria Logs can be added to EPA Docker Compose stack with truly minimum RAM resources. Soon, it will also lower its block storage requirements and with Versity S3 Gateway attached to E-Series, it's a cost effective and fast-performing object store for log retention.
With Hybrid E-Series, you can get best of both worlds:
- Compression by Victoria Metrics and Victoria Logs
- Leading performance NVMe/RoCE or NVMe/FC for Hot Tier
- Modern and fast-developing S3 gateway in Versity S3 Gateway (even Elasticsearch 9 can use it for S3 snapshots)
- Leading value, reliability and price/performance for Warm Tier (as an example, see S3 GET)
- Replication (for DR or low-cost archiving) is trivial with Rclone
While EPA, SGAC, SGII may have reference stacks, they are not entangled in them. They are stand-alone tools that are easily reused and combined into other stacks. That isn't by accident - it is the preferred, intended, and recommended approach.
The UI in SANtricity 12 was a big step back for user experience and especially so when it comes to performance monitoring. EPA is a usable and customizable alternative for out-of-box gathering of SANtricity performance metrics without unnecessary bloat and risk.