StorageGRID and Elasticsearches
Why "Elasticsearches"?
Because there's more than one. And people often don't even know enough to be confused.
Wait, what?
There are two things you can currently (NetApp StorageGRID 11.7) do with Elasticsearch more or less "out of the box":
- Log forwarding
- Search
There's are also things Elasticsearch can do with StorageGRID out of the box, but this post is not about that:
- Snapshots
- ILM
Log forwarding
This is often referred to as "audit log forwarding" (which is wrong), even by people who should know better.
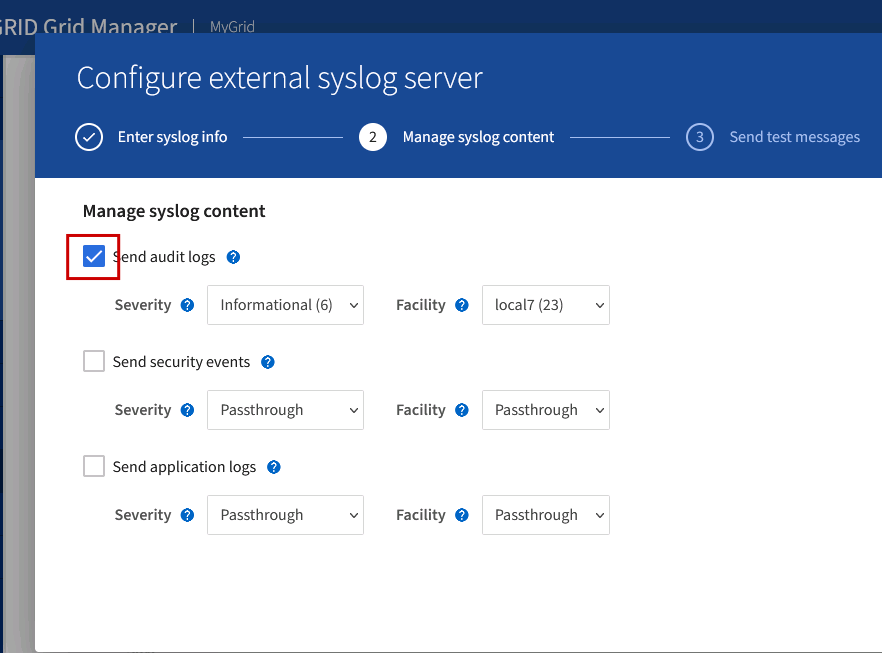
First, there are three log types that can be changed to a non-default setting.

One could, for example, send only Security events to an external syslog server. Most people don't do that. As shown in the screenshot, most people need to archive and search their audit log. So the other types can be left as-is (Admin & Local nodes), which is what you see in the screenshot.
Those who forward more than one need to figure out which lines come from which log type, and process them accordingly. So it's also a bit more difficult to forward more than just archive log.
Second, how does that work with Elasticsearch? It doesn't.
As the name says, we need just a standards-compliant syslog-compatible destination. What standards?
Well, some of them syslog RFCs. The docs should say which one(s), but they don't.
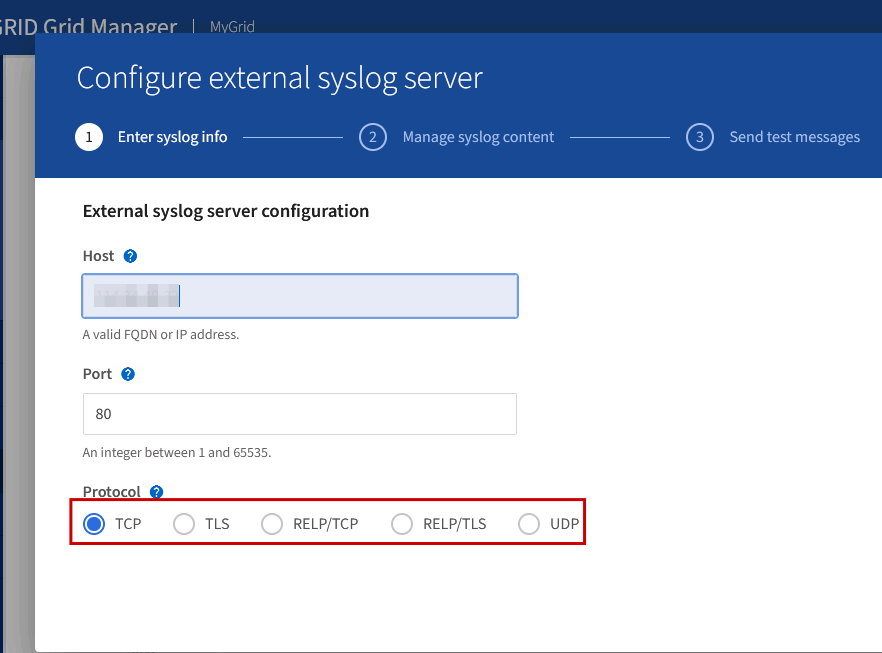
In any case, there's no Elasticsearch involved here. Logs could be forwarded to rsyslog or syslog-ng or Logstash or some other program.
As we change the defaults, we do it for audit logs only, and leave the rest unchanged.
From there (syslog forwarder) we can send data to Elasticsearch, or process it first, and then send to Elasticsearch.
In versions prior to 11.5 I used a Python script (SGAC) to convert audit.log to JSON-LD and ingress it to Elasticsearch with Logstash, but now - since logs can be forwarded to a syslog-compatible destination - one can do such things on the fly.
The NetApp Web site has a service configuration script that can be used for that with Logstash 7 and 8.
Finally, once audit log data is ingested and indexed in Elasticsearch, you can easily search all audit log events, create reports, and more.
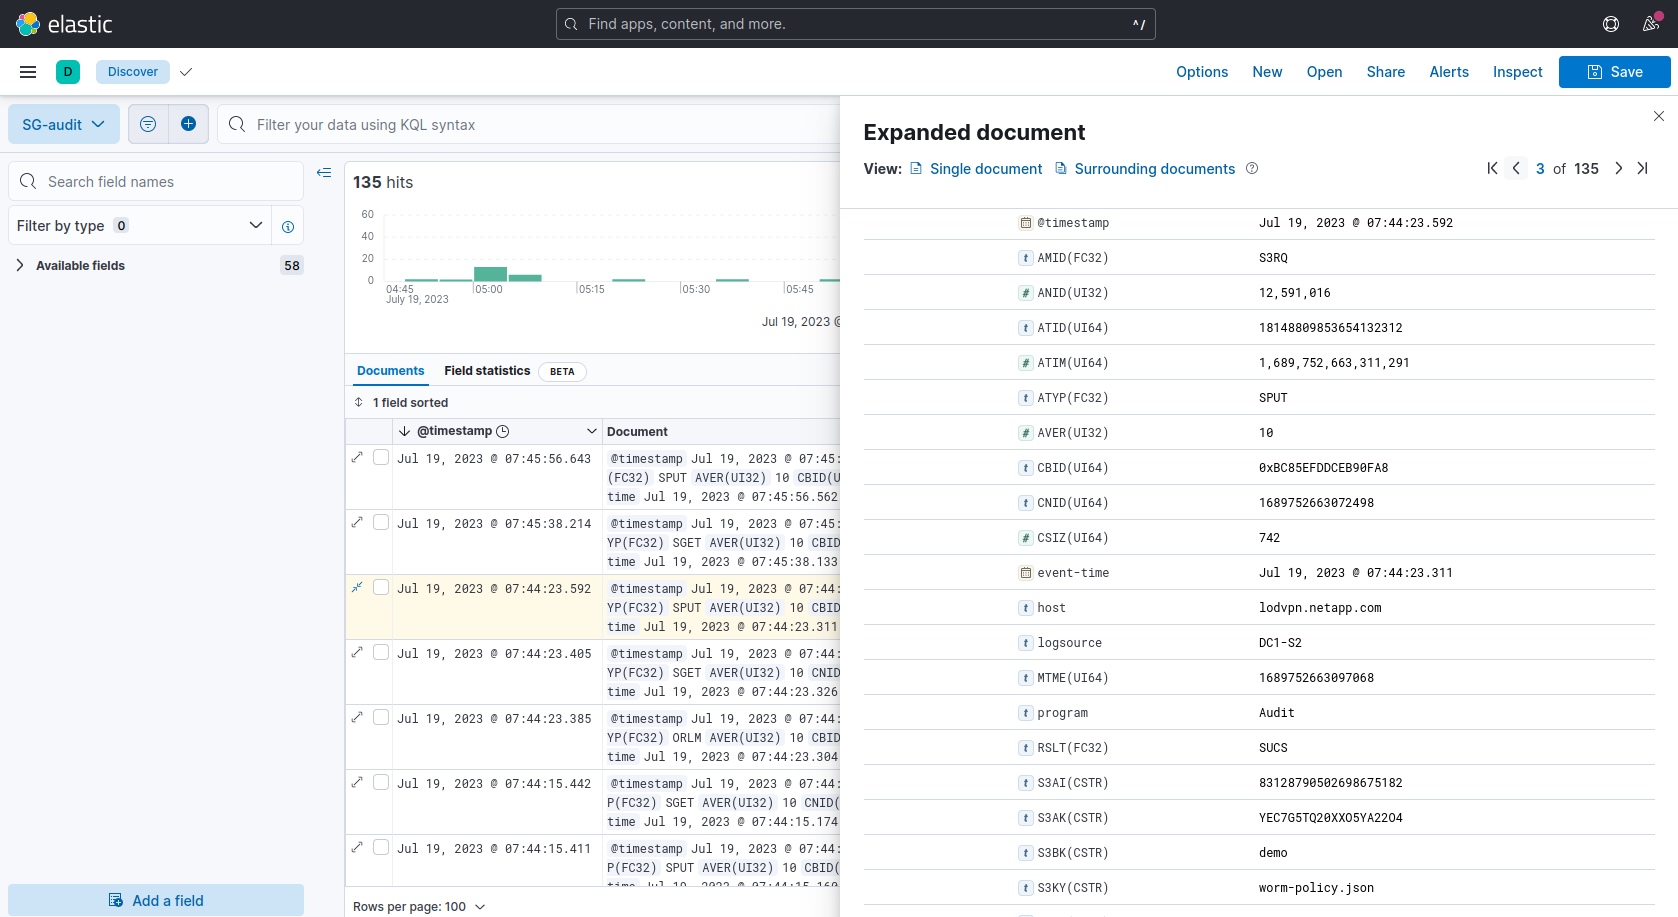
One example of "and more" would be to trigger alerts when the number of DEL or GET events becomes unusual as that may be a sign of an attack.
Search
StorageGRID search is a platform service. The grid (cluster) admin optionally enables it for each tenants. Tenant admins with Platform Services enabled can create a platform service endpoint (one or more) and then - for the search type of service - may configure selected buckets to work with those endpoints.
Here we see an API endpoint for Search.

This obviously uses the Elasticsearch (or Opensearch versions compatible with Elasticsearch) API and isn't related to syslog.
In fact, in API endpoint settings we can see that StorageGRID authenticates against Elasticsearch API (normally on port 9200).
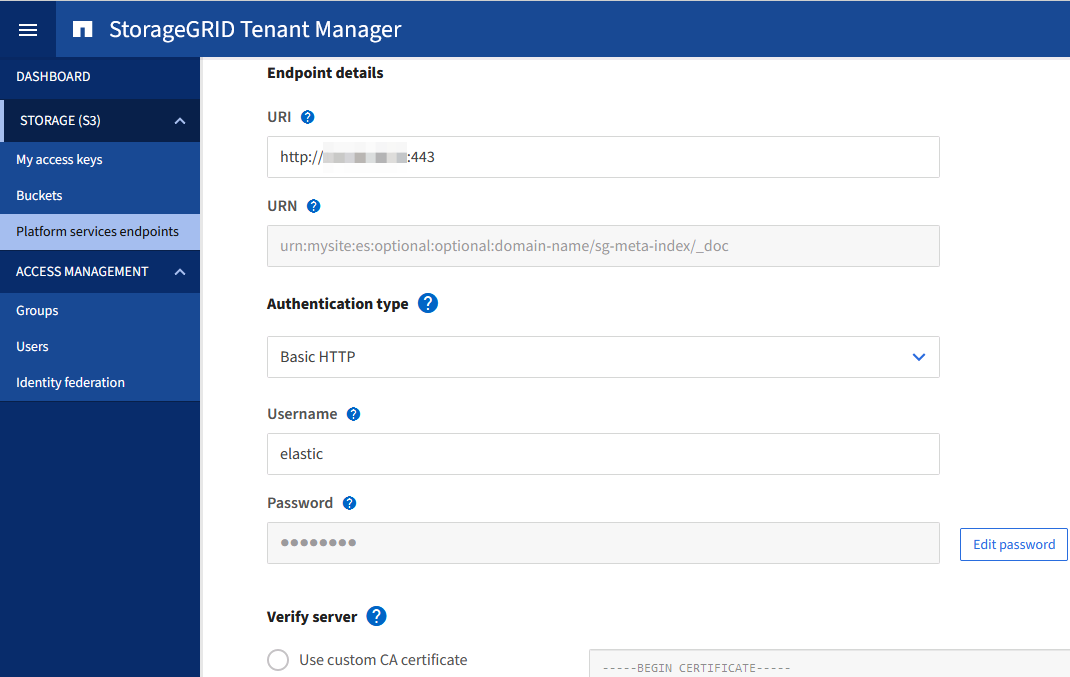
Once this API connection is in place, search is enabled by tenant admin on the bucket level, by defining rules and endpoints that rules should use.
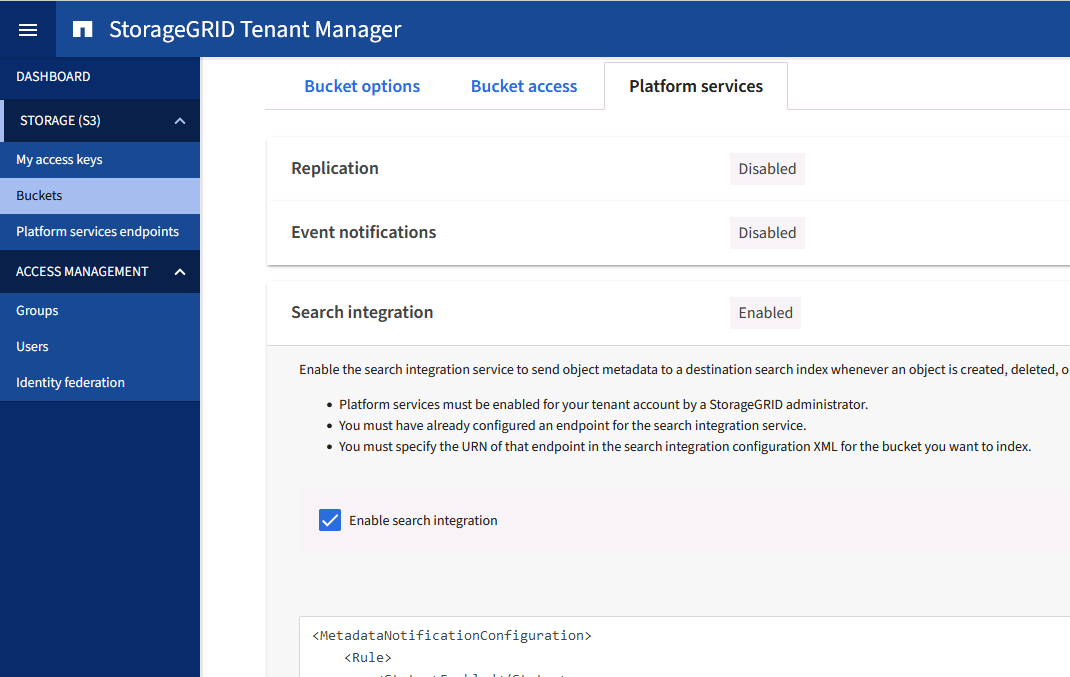
XML configuration file is cut off in the screenshot, but the StorageGRID documentation has a complete example.
Main takeaways:
- One can have multiple rules of what to make searchable per each bucket
- Each rule may use a different search endpoint defined for the tenant
- The easiest way is to have one rule that sends all bucket changes to the same Search endpoint (one bucket, one search index)
This makes it possible to set one rule for s3://teambucket/groupa/*.json and send object changes to one instance of Elasticsearch, and have a different rule for s3://teambucket/groupb and use another Elasticsearch instance or index for it.
The number of documents in Elasticsearch index corresponds to the number of current objects in the bucket. A deleted object results in one less item in Elasticsearch bucket index. Five documents in the index mean there's five documents in the bucket.
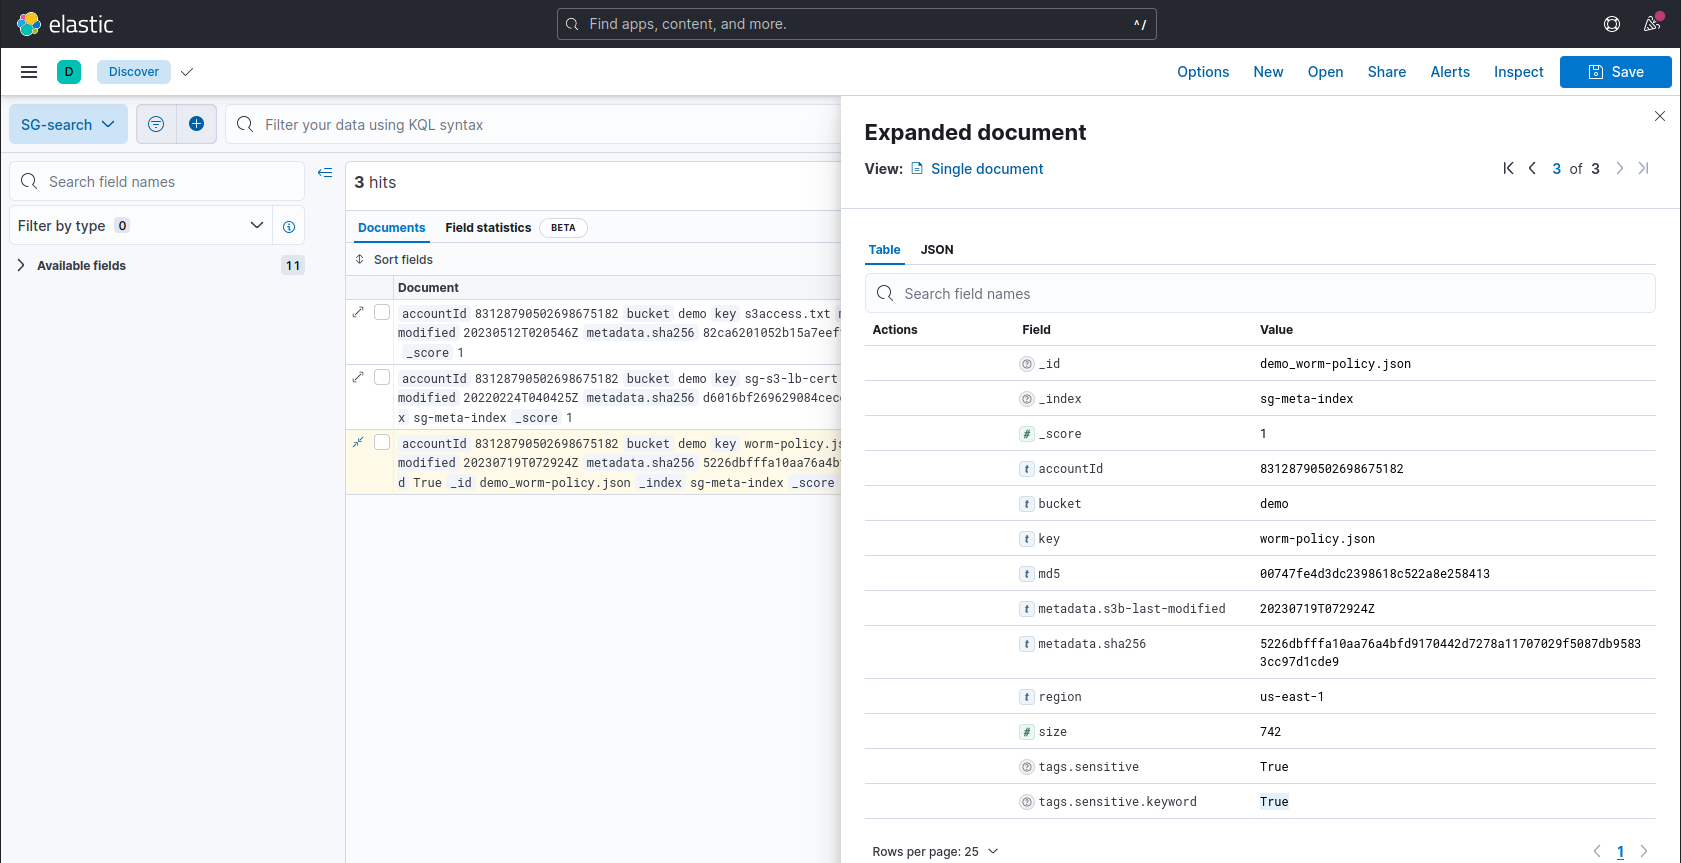
Notice that there's no "last modified" in system metadata. As of StorageGRID 11.7, if you need to search based on last modified dates, make sure you append that date to object metadata client-side when you PUT it to StorageGRID.
In general, system metadata are fixed and set by StorageGRID while tags can be set by the user, which is why this "workaround" is possible.
Search vs. audit log index
Audit log indexes are additive - they grow all the time. We also want to delete audit log indexes (as they age beyond our required retention limit, for example).
Search index can also shrink, as explained above, and we normally want to have just one per bucket.
Therefore an audit log may look similar to what we have in this screenshot - one index per day, with thousands or maybe even millions of documents (records) in each - while a search log may be just one per bucket, and smaller (thousands or tens of thousands of documents).
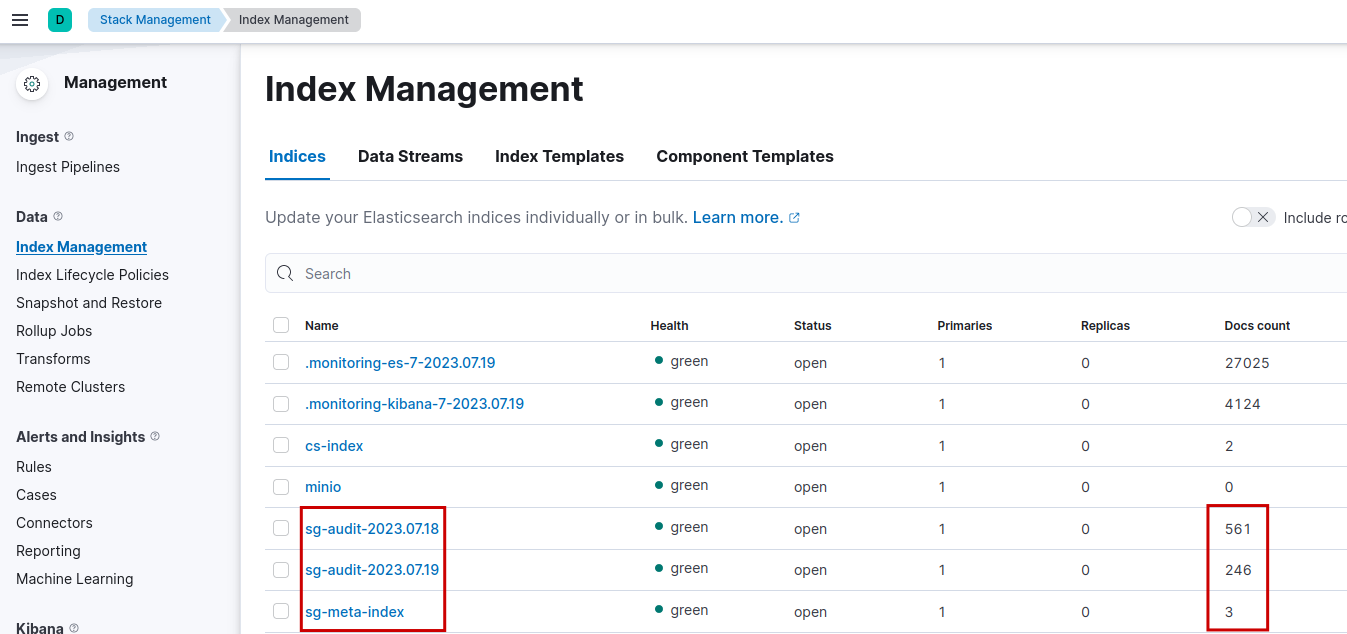
But different setups are definitively possible and even realistic.
For example, as explained in Search section, you may want to have multiple search indexes for a single bucket, either in one Elasticsearch cluster, or even in different Elasticsearch clusters.
Likewise, if you work on short-term projects, audit log index could be just one, and backed up once the project is completed.
Demo
Just to give you an idea of where's what in the UI and how it "feels" like, here's a short demo video.
Conclusion
StorageGRID logs can be forwarded and indexed anywhere. The main requirement is that the first recipient is a syslog-compatible server. Logs are normally kept on StorageGRID cluster, but all can be forwarded externally. Normally just one (audit log) is.
Search platform service uses the Elasticsearch API.