Use Cloud Sync API and Elasticsearch to improve data replication
Why and when automate Cloud Sync?
Some NetApp Cloud Sync users have many sync relationships (as in dozens).
(As of recently the new name for Cloud Sync is "BlueXP Copy and Sync", but I won't use it.)
At that scale, the use of the Cloud Sync API can become justified.
To illustrate these possibilities, I recently prepared a simple PoC with the following elements:
- Use the Cloud Sync API to fetch various details that BlueXP (Web UI) users see in the browser
- Discard unnecessary data, process some data on the fly, and send records to Elasticsearch
- Elasticsearch 8 (I used the entire stack, ELK) : receive and index data
Obtain metrics using the Cloud Sync API
There's no "magic" here, just use what's documented in the API to get the stuff you need.
The trick is figuring out what you need and why, and "it depends" - as always.
Many uses want to watch the progress of synchronization, so let's take that use case.
There are other (niche) use cases such as watching Data Broker reports, but to keep the post short I'll stick with the common one.
I used PowerShell for this, because it's nice to work with.
Send to Elasticsearch
Here I used Python, not becuase PowerShell can't do this, but because I've been thinking about adding ELK integration to E-Series Performance Analyzer.
Since I had ELK at my disposal, I could have sent data to Logstash or use Filebeat which would be appropriate for production.
We take interesting details from the API and send documents to Elasticsearch using Python Elasticsearch module for Elasticsearch 8.
Note that I timestamp records with current time - that's close enough as my Python script imports JSON files exported by the PowerShell script. We wouldn't want to complicate things like this in production, of course.
{
  "timestamp": "2023-02-05T16:27:34.876Z",
  "id": "63dce3623f83060d724d4ced",
  "name": "Object2Object",
  "dataBroker": "63da1d9d3f83060d7208a84a",
  "relationshipId": "63dce3623f83060d724d4ced",
  "relationshipSrcHost": "https://s3.datafabric.lan",
  "relationshipSrcBucket": "cloudsync-in",
  "relationshipSrcPrefix": "",
  "relationshipTgtHost": "https://s3.datafabric.lan",
  "relationshipTgtBucket": "cloudsync-out",
  "relationshipTgtPrefix": "",
  "relationshipGroup": "63da1d9d3560a85f8df26db3",
  "relationshipProgress": 80,
  "relationshipStatus": "RUNNING",
  "relationshipType": "Sync",
  "relationshipExecTimeMsec": 133595,
  "relationshipStartTime": "2023-02-03T14:20:06.23Z",
  "relationshipEndTime": null,
  "relationshipFailureMessage": "",
  "relationshipCreatedUtc": "2023-02-03T10:35:15.119604Z"
}
What's usually interesting to Cloud Sync users is the progress (80% in this record above) of data synchronization.
For long running jobs with gigabytes of data or millions of files synchronization may take hours in which case it is likely to progress gradually, and for very short it can go from 0 to 100% in one step. But in any case, timestamps increase and if everything goes well the indicator eventually reaches 100%. Or it fails or get stuck, and we can check another index with error messages from Data Brokers.
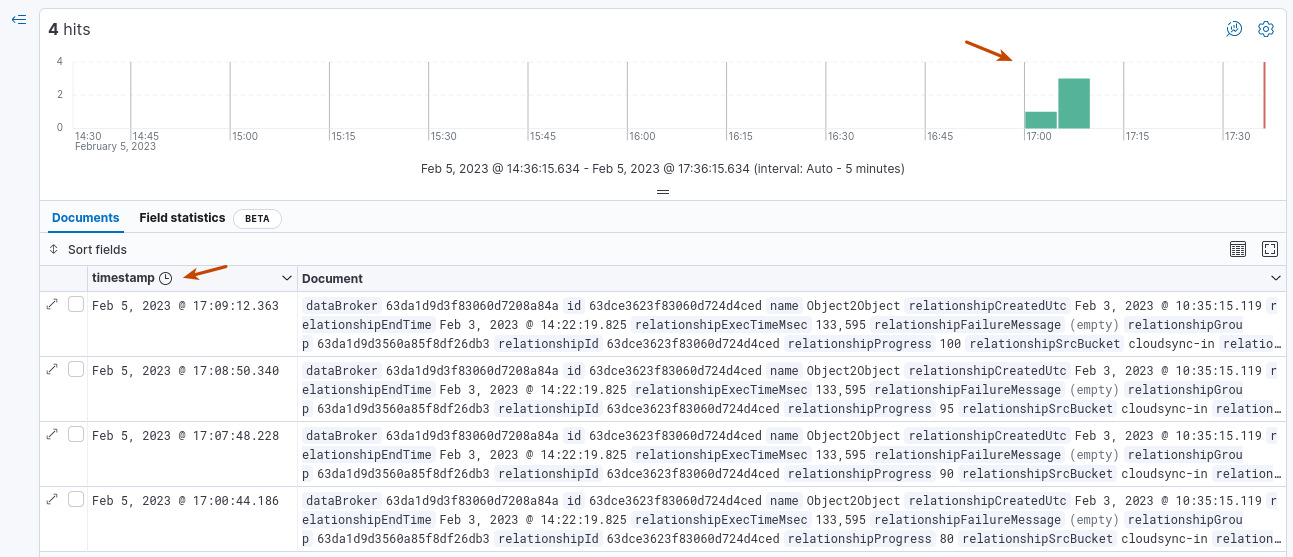
There's only four records as the job finished quickly.
With many relationships we may want to monitor just one. If I'm curious about just one relationship, I can search this index by Cloud Sync relationship name.
Otherwise I may use the asterisk (*) to watch all of them. Or maybe watch a group based relationship group value.

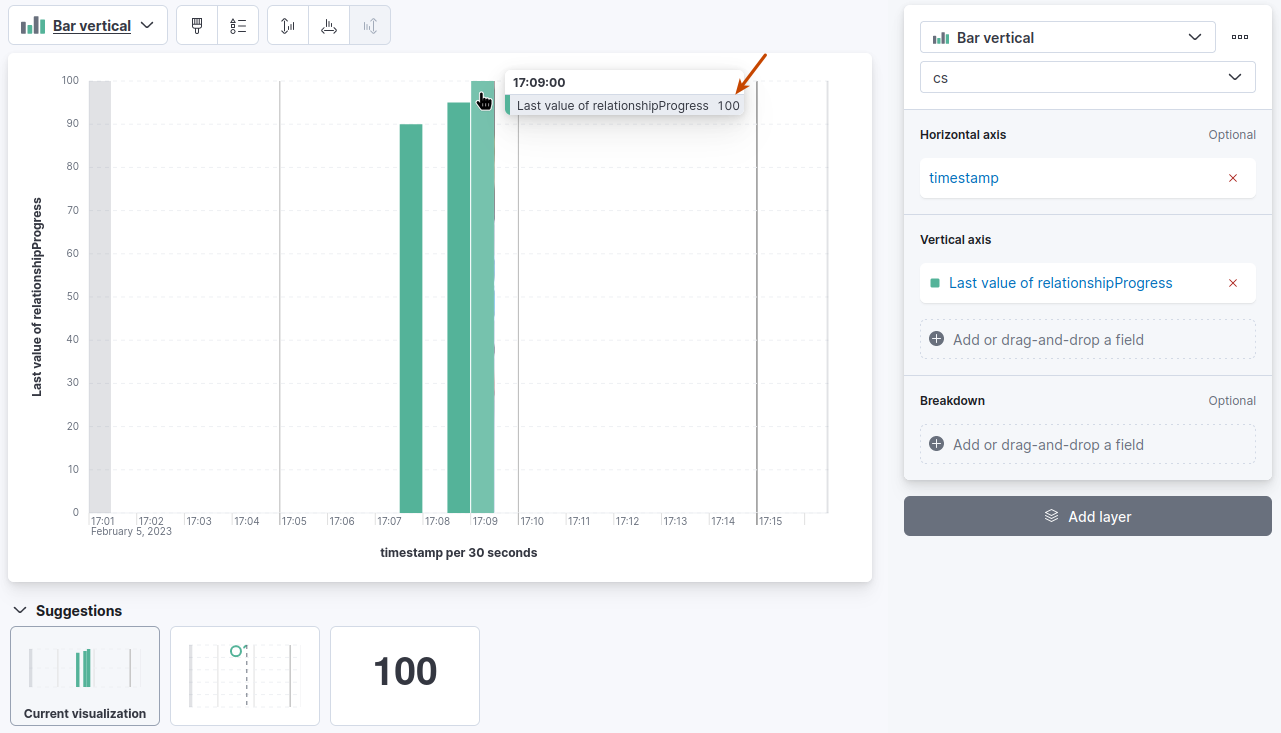
These can now be visualized and turned into a dashboard, so that we can watch them as they move from 0 towards 100%.
I watched just one relationship which synced quickly, so there was just one bar going from 80% to 100%.
With half a dozen relationships there would be six bars, or maybe we'd use six different charts in one dashboard.
Other approaches
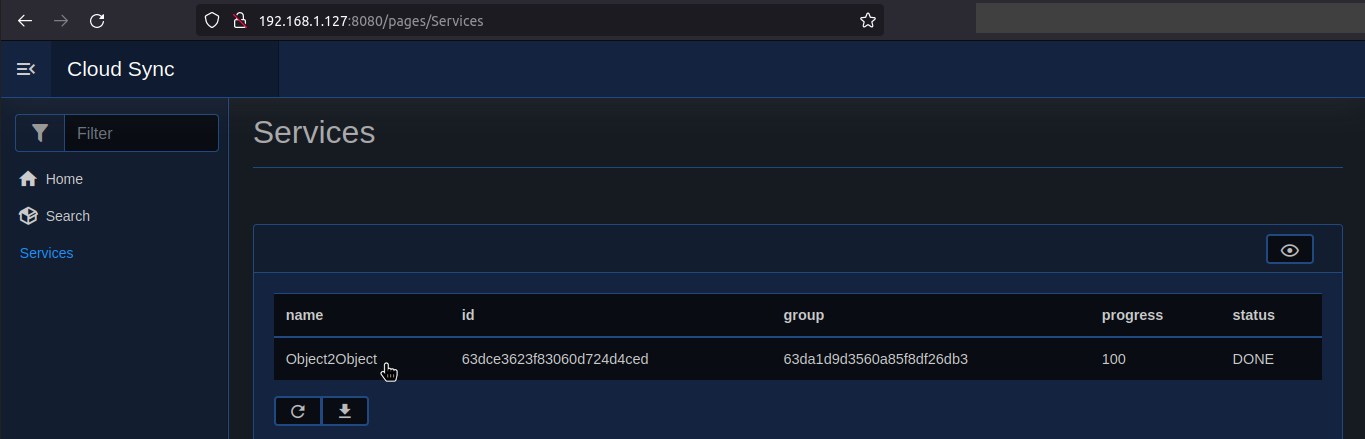
Users who don't have something like Elasticsearch can serve reports and status updates from a simple Web server with static or dynamic content.
This minimal Web app shows a table of Cloud Sync relationships and selected details.
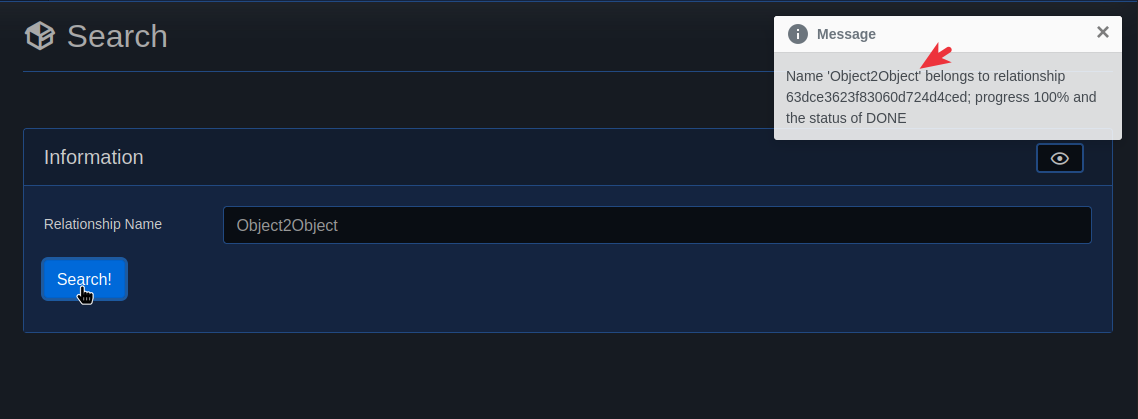
The same data is available through a search feature - it's enough to know (part of) the relationship name such as 'Object' to be able to find progress of a relationship named 'Object2Object' without logging in to BlueXP.
What else can be done
As hinted earlier we can get Data Broker reports which have "worker" details, errors (if any) and more. All that can be used to improve and even tune Cloud Sync Data Broker options.
Another interesting area is viewing relationships over time, and point-in-time "worker" (Data Broker) reports. This lets us see how a sync relationship changes over time in terms of data volume, file/object sizes and such, which can serve as a reminder to revisit Data Broker setup or re-evaluate tuning parameters. Or even just find the busy relationships and identify Data Brokers that should be tuned.
Another opportunity is to watch the entire stack: Source, Target, Data Broker(s), network, and more, and with that it becomes easier to learn what can be done better. For example, we could use different Data Broker configurations on repetitive runs and see which configuration is optimal.
This reminds me that Elasticsearch has built-in Machine Learning features, so it can identify anomalies - good and bad - for you.
Once we have some automation working, it becomes easy to automate more of the entire workflows - initial relationship configuration, Data Broker deployment (which can be tied with Virtual Infrastructure automation), reporting and more.
One "low-hanging fruit" for me was report generation which as the name suggests is a point-in-time snapshot of the Source or Destination as seen by Data Broker: normally these are generated on-demand in the Web UI, but you also need to delete them (if you don't want to keep them). With a script periodically polling sync relationships' status, I used the opportunity to periodically delete old reports (example: > 14d old), and also generate a report once a relationship progress hits 100%, so that it becomes available in the Web UI for users who use it.