Applications and Workloads in NetApp SANtricity Web UI
Introduction
Even in SANtricity 12.0x (as versions are now referred to in TFM), you'll see this offer to define a (presumably "suitable and optimal") workload for your new volume.
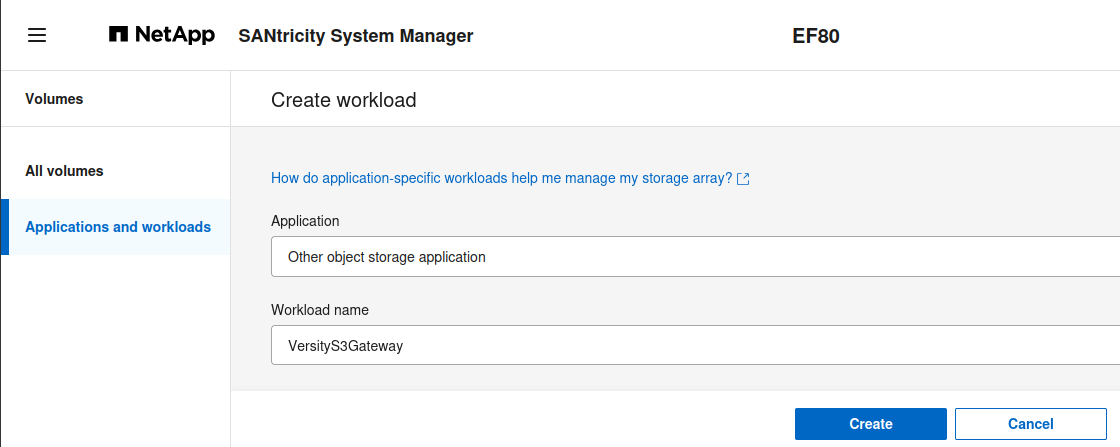
There's a link that takes us to TFM that tells us everything we need to know about it (for SANtricity 11.9x, as that answer is richer than now): here. In v12.0x:
How do application-specific workloads help me manage my storage array?
The volume characteristics of your application-specific workload dictate how the workload interacts with the components of your storage array and helps determine the performance of your environment under a given configuration.

What it really does and what can it do?
To answer the first question: as far as I can tell, nuthin'. And that's a very good thing, mind you, considering that there's no documentation on what picking a workload does to your volume. If it did something, that would be even worse!
That aside, the fact that SANtricity likely doesn't do anything with that information and settings doesn't mean you have to do the same. It maybe can't do anything with that information, but you can.
First, what's what? In my own words, as I don't know anything about it beyond what I see in TFM and Swagger:
- Application: a workload pattern or "broad application profile"
- Workload: an instance of application
The good news is you can define your own applications and, in all likelihood, SANtricity won't "tune" (or un-tune) default volume settings.
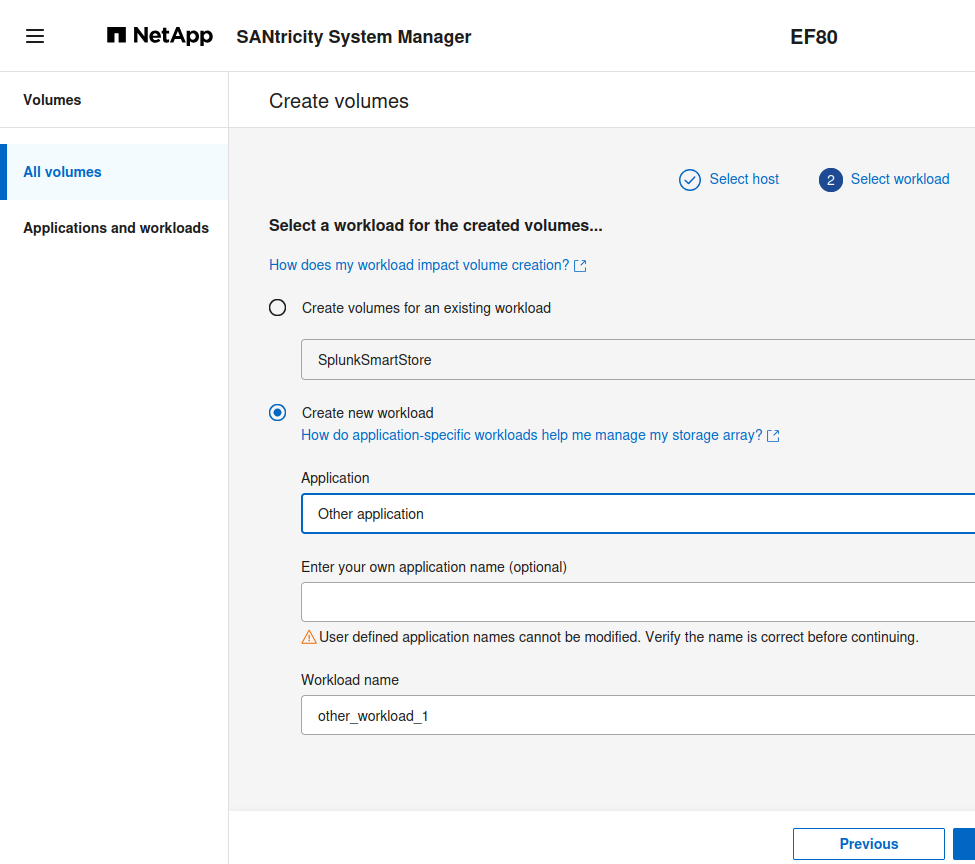
In this screenshot we're creating an entire application category (even though it's just a config object that doesn't do anything). Other Others, so to speak.
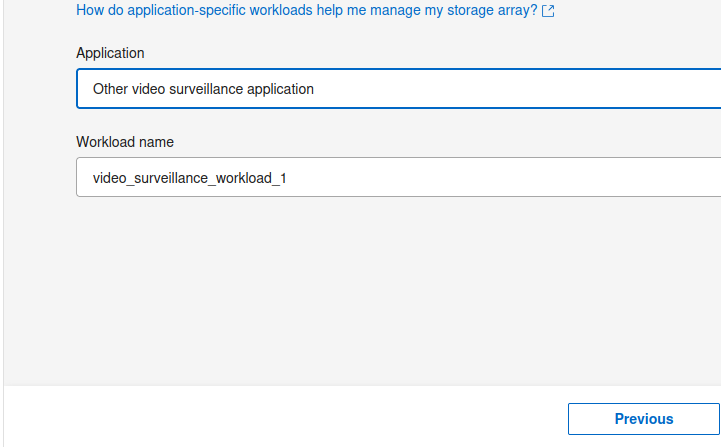
If you want less fancy, you can take one of the predefined Others, which has one field less.
But these aren't the only "other" choices, though. I don't know what to say about this except that children somewhere are fortunate because the person who came up with this didn't become a librarian.
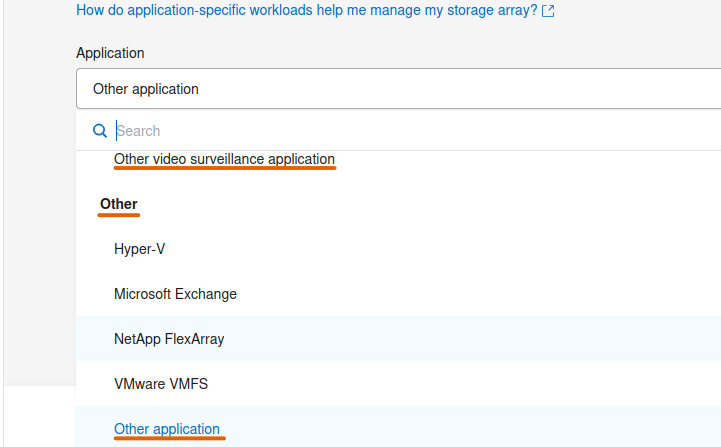
So, pre-defined others are different from other others, but in practice there's no real difference. In the unlikely case anything is done with these settings, other Others would be safer.
Once you create a few of these, this is what that looks like in SANtricity 12.0x.
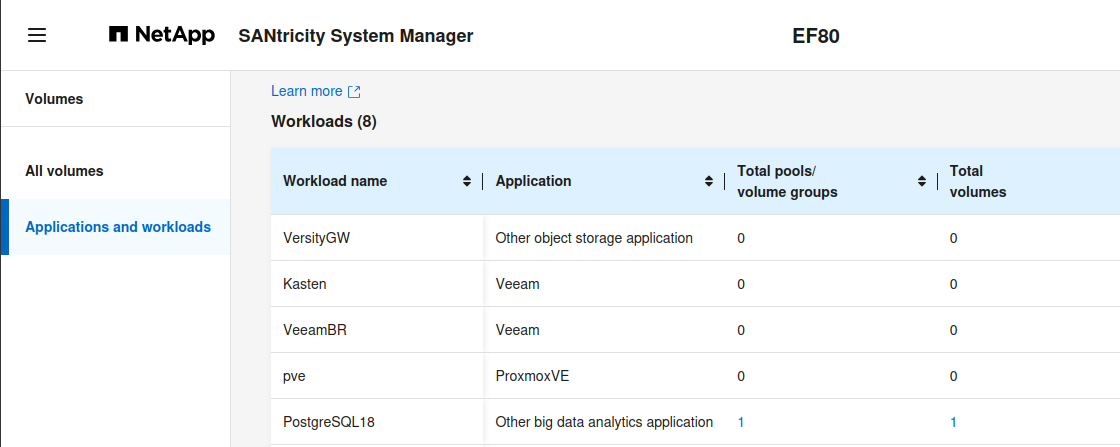
One final observation is that the same application and workload can belong on vastly different volumes:
- Application:
VMware VMFS - Workload:
vSphere9 - Volumes:
vmw9on R6 on DDP andvmw9vol1R10 on RAID 10
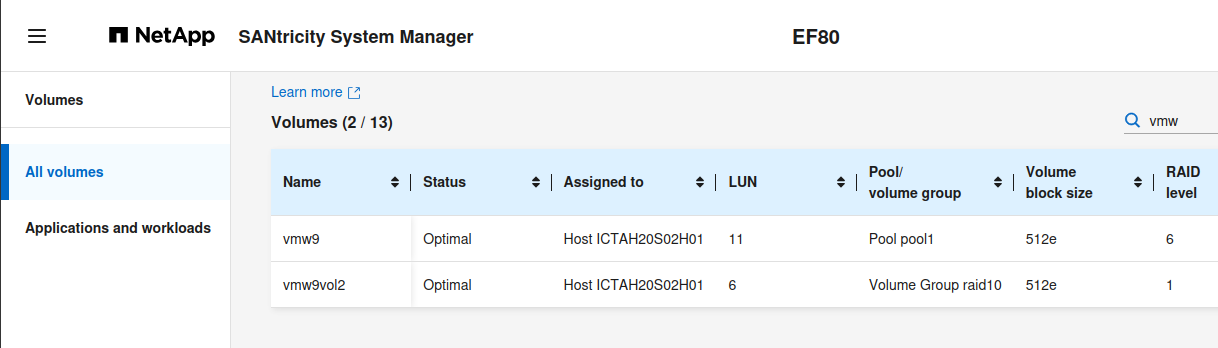
"Recommendations" based on application and workload attributes could be invalid, so there are several ways one could use this:
- consider everything holistically (app, workload, configuration, performance), and/or
- tag volumes more granularly (vSphere9R10, vSphere9R6), and/or
- keep generic tags if you use them for backup, show-back, cost-back or other purposes where you won't change volume settings based on workload tags
Now that we've cleared that up, let's see how we can work around this feature!
Working around this feature
The first method is to ignore it. That's easy: don't use it and it won't bother you.
The second method is to do something with it on your own. This is how these workloads look like in API responses.
[
  {
    "id": "4200000001000000000000000000000000000000",
    "name": "VersityGW",
    "workloadAttributes": [
      {
        "key": "profileId",
        "value": "Other object storage application"
      },
      {
        "key": "isUserDefined",
        "value": "false"
      }
    ]
  },
  {
    "id": "4200000003000000000000000000000000000000",
    "name": "Kasten",
    "workloadAttributes": [
      {
        "key": "profileId",
        "value": "Veeam"
      },
      {
        "key": "isUserDefined",
        "value": "false"
      }
    ]
  }
  {
    "id": "4200000005000000000000000000000000000000",
    "name": "pve",
    "workloadAttributes": [
      {
        "key": "profileId",
        "value": "ProxmoxVE"
      },
      {
        "key": "isUserDefined",
        "value": "true"
      }
    ]
  }
]
As I've said, I don't think SANtricity could possibly know what to do with a "Kasten" workload even though it's tagged with a "Veeam" application profile and, if it did, that would be wrong in any case.
Or, what is it supposed to do with a user-defined workload "pve" for application "ProxmoxVE" that does not exist (as I'm registering a workload before the first PVE workload has been onboarded)? The correct answer is: nothing.
In this case, if we wanted to create meaningful distinctions, we should create workloads like "pve-lvm", "pve-zfs", "pve-btrfs". PBS (Proxmox Backup Server) would be a separate application (profileId), by the way, and we could benefit from distinctively configured workloads for VM and file backup, although that wouldn't apply if PBS-tagged volumes are used for both.
Just in case SANtricity starts doing something with the pre-defined Others one day, choose other Others. But there's no reason to overthink this, so let's continue.
Once I have these custom apps and workloads, we can do the following four things with the API:
- Get application/workload configuration
- Get volume configuration
- Get volume, controller, system performance metrics
- Use intelligence to decide how to optimize volume settings for applications, workloads and performance metrics gathered
ESC was able to do the last three since last year, two quarters before … one other "AI monitoring app" you may have heard of.
ESC had the following built in:
- Natural language SQL queries in InfluxDB UI backed by LLMs
- InfluxDB MCP server for query assistance to end user
This is what Natural Language queries looked like at release in October 2025:
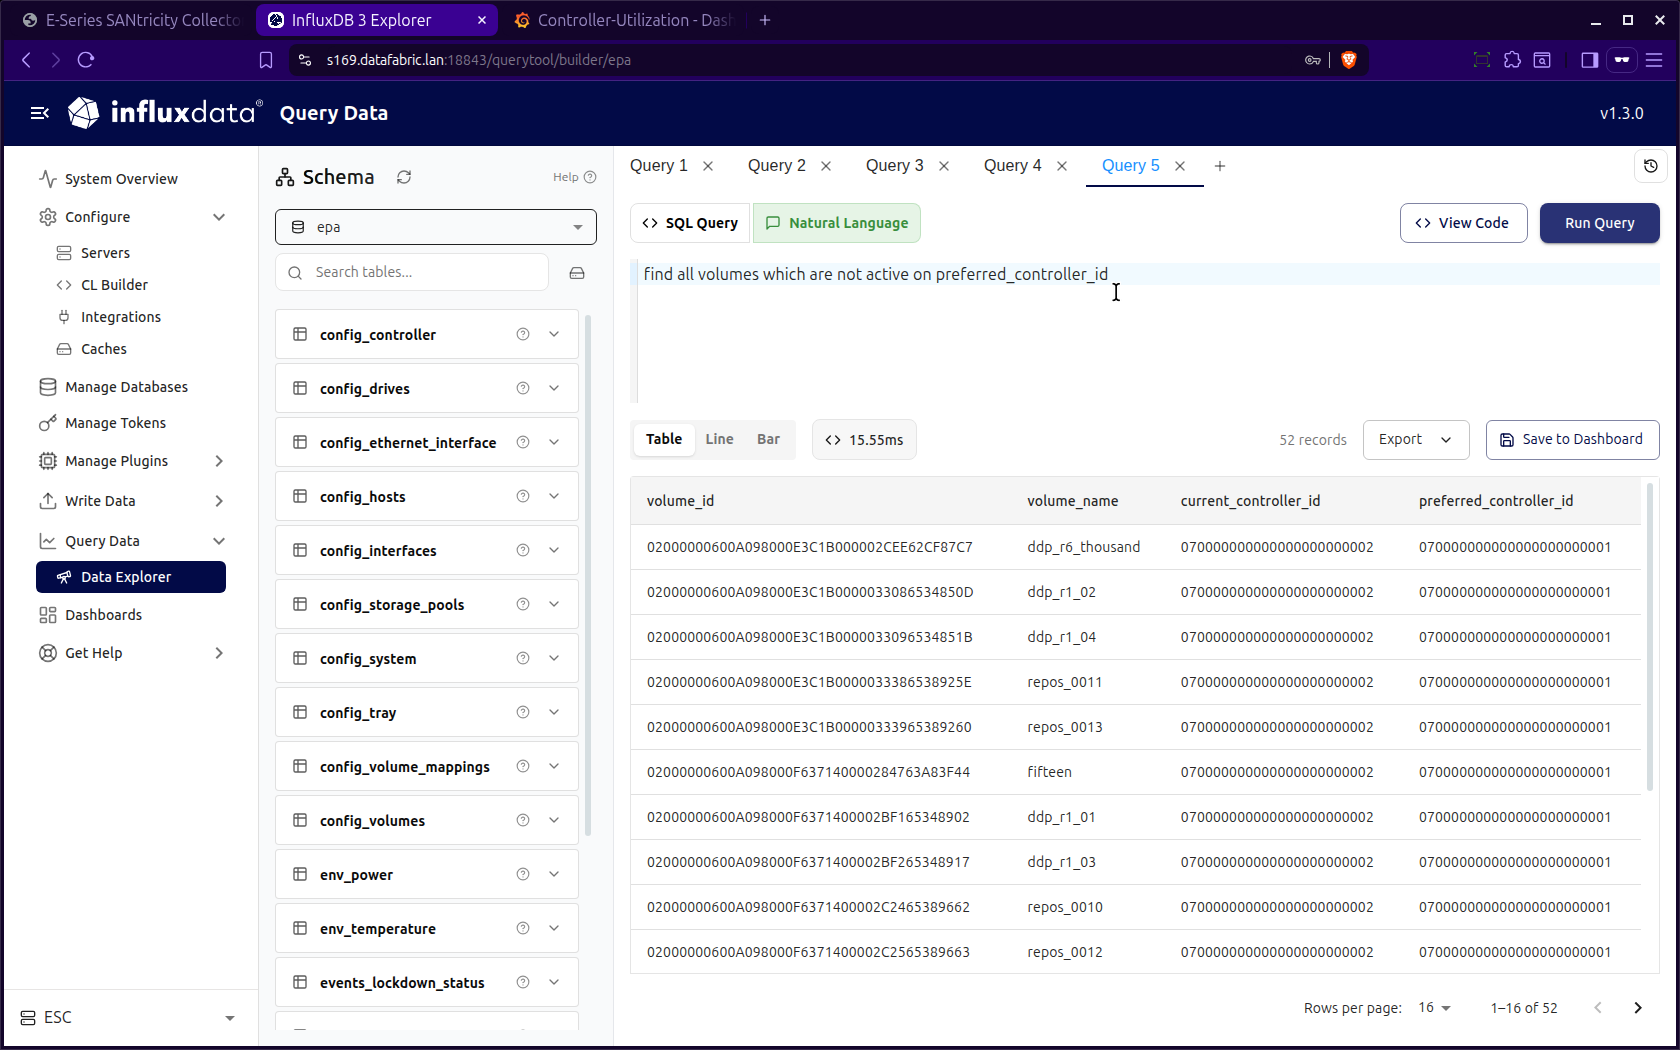
(I should have taken a screenshot of a less contrived question, because those are answered, too, but I didn't "pump" this feature and share this even in the ESC repository.)
The first item (workload configuration) isn't/wasn't fetched by ESC or EPA not because it's hard to do - it's in fact easy becuase it's just several text strings that have no effect on anything - but because I've never heard of anyone who uses the "workload" feature.
Let's assume we start using it. Here's what a workload-tagged volume would look like (trimmed a bit):
{
  "volumeHandle": 10,
  "raidLevel": "raid6",
  "worldWideName": "3233343536373839303134323700000000000000",
  "label": "smart_store_2",
  "blkSize": 512,
  "capacity": "137438953472",
  "segmentSize": 65535,
  "cache": {
    "cwob": false,
    "enterpriseCacheDump": false,
    "mirrorActive": true,
    "mirrorEnable": true,
    "readCacheActive": true,
    "readCacheEnable": true,
    "writeCacheActive": true,
    "writeCacheEnable": true,
    "cacheFlushModifier": "flush5Sec",
    "readAheadMultiplier": 0
  },
  "volumeRef": "3233343536373839303134323800000000000000",
  "status": "optimal",
  "volumeGroupRef": "3233343536373839303133393100000000000000",
  "dssMaxSegmentSize": 0,
  "preReadRedundancyCheckEnabled": false,
  "cachePoolID": 0,
  "blkSizePhysical": 4096,
  "pitBaseVolume": false,
  "diskPool": true,
  "flashCached": false,
  "metadata": [
    {
      "key": "createdBy",
      "value": "SANtricity System Manager"
    },
    {
      "key": "createdUTC",
      "value": "1775710845"
    },
    {
      "key": "workloadId",
      "value": "4200000008000000000000000000000000000000"
    }
  ],
  "dataAssurance": true,
  "objectType": "volume",
  "currentControllerId": "070000000000000000000001",
  "preferredControllerId": "070000000000000000000001",
  "totalSizeInBytes": "137438953472",
  "name": "smart_store_2",
  "id": "3233343536373839303134323800000000000000"
}
We can cross-reference workloadId 4200000008000000000000000000000000000000 with our defined workloads and find what that is.
{
  "id": "4200000008000000000000000000000000000000",
  "name": "SplunkSmartStore",
  "workloadAttributes": [
    {
      "key": "profileId",
      "value": "Splunk"
    },
    {
      "key": "isUserDefined",
      "value": "false"
    }
  ]
}
All right, so that's all it takes and we have all four items collected.
Assuming these are set correctly, now not only do I know my performance profile from existing ESC- or EPA-gathered metrics, but I can also check if those make sense for a Splunk SmartStore workload.
How would an AI know? Well, there are posts on the topic and as I've observed, AI models feed on blog data, so the user can close the loop entirely without the "workload" feature working at all. There is also generic advice for SmartStore out there, so we're better with than without that bit of information as long as it is correct.
What's next
I'm working on this now not becuase I wasn't aware of it, but because last year I knew no one who used these.
However, since then I've created SANtricity CSI and now there is metadata in volume configuration objects of all SANtricity CSI users (there may be 2-3 of them, I figure). Oh, this reminds me: I think I added Trident CSI metadata collection to SolidFire Collector two years ago - that also gathers metadata from my SolidFire CSI.
Now that SANtricity volume metadata is being generated more (and there will be still more of it in the future) adding volume workload and metadata collection to EPA and ESC begins to make sense.
Client and service readiness:
| App | Status | Comment |
|---|---|---|
| SANtricity Web UI | OK | fixed format, workload metadata |
| SANtricity CSI | OK | fixed format, CSI-related metadata |
| SANtricity PowerShell | TODO | client |
| SANtricity Go | TODO | client |
| SANtricity Client (Python) | TODO | client |
| E-Series Perf Analyzer | WIP (3.6.0) | get, store any volume metadata |
| E-Series SANtricity Collector | TODO | get, store any volume metadata |
| Terraform Provider SANtricity | TODO | get, set volume metadata |
| SANmox | TODO | get, set volume metadata |
The clients are easier to deal with and PowerShell is probably more important than others. The tricky part is deciding what to do and how. Fixed workload metadata? Custom? Or both? What if both is more powerful, but harder to use?
EPA 3.6.0 (currently work in progress - screenshots and tables in this blog post come from it) will likely be the first service to collect metadata and while InfluxDB UI is already there. It's just one small table.
+------------------+----------------------------------+-------------------------+
| table_name       | column_name                      | data_type               |
+------------------+----------------------------------+-------------------------+
| config_workloads | id                               | Dictionary(Int32, Utf8) |
| config_workloads | name                             | Dictionary(Int32, Utf8) |
| config_workloads | sys_id                           | Dictionary(Int32, Utf8) |
| config_workloads | sys_name                         | Dictionary(Int32, Utf8) |
| config_workloads | time                             | Timestamp(ns)           |
| config_workloads | workloadAttributes_isUserDefined | Boolean                 |
| config_workloads | workloadAttributes_profileId     | Utf8                    |
| config_workloads | workload_name_field              | Utf8                    |
+------------------+----------------------------------+-------------------------+
Then, as we intelligently look through data to work with, we're better off even if the volumes are cryptically named.
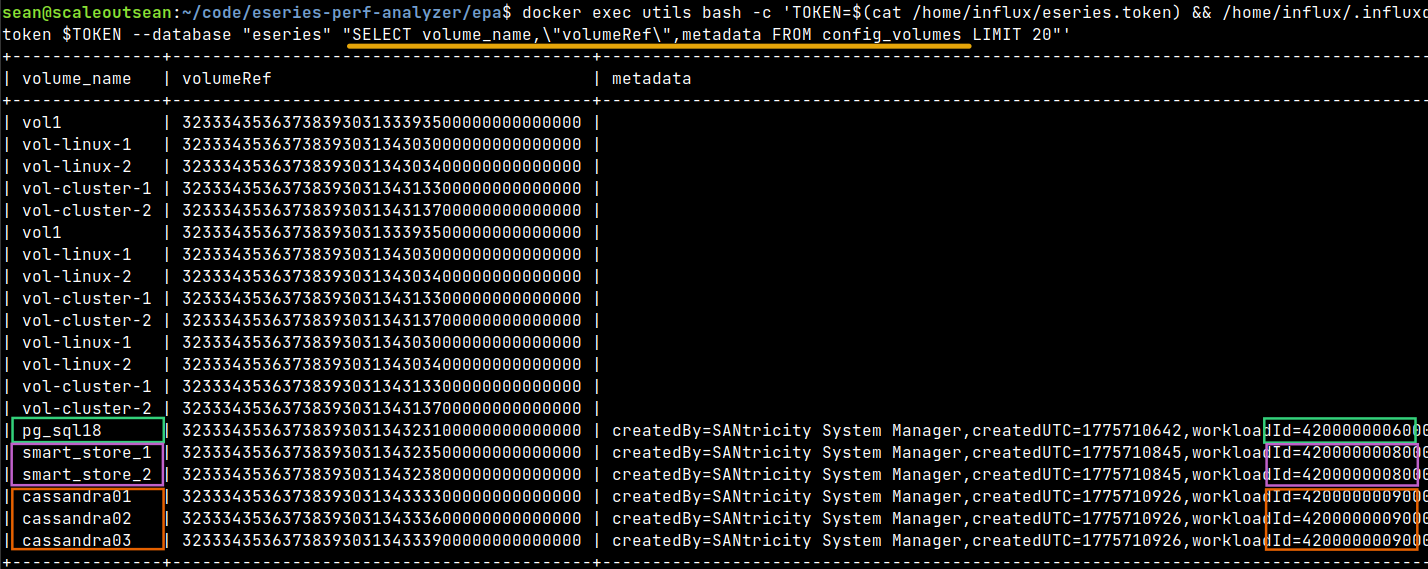
This screenshot shows metadata set by SANtricity UI. SANtricity CSI will look different, but it will still be useful.
ESC will be next application to support these because I need to find more time to update the entire stack and ESC is not a tiny application.
Conclusion
The workloads feature doesn't look useful, but it can be made useful.
In addition to data (performance metrics and volume name (which may or may not be telling)), we'll also have some, or even a complete, idea about the application that is using the volume. We can get that info from SANtricity-configured workload settings, or by cross referencing SANtricity CSI data against Kubernetes. It works the same way for VMware, Hyper-V or PVE (we can get this from my SANtricity-LVM plug-in for PVE or SANmox TUI).
That will improve our ability to manage SANtricity without any privacy or other compromises.
For simpler use cases such as show-back, per-cost-center tagging (app "vSphere", workload "VMW-HR") is easy enough - just filter volumes with that tag, add up their capacity and you're done - no need for AI. You can create these reports with my SANtricity PowerShell modules today, but once EPA 3.6.0 comes out, both "per workload" current status and values over time will be viewable in Grafana as well.