Cloud-Native Postgres Performance with NetApp SANtricity NVMe/RoCE
- PART ONE: CloudNativePG with CSI snapshots
- PART TWO: CloudNativePG backup with Barman plugin
- PART THREE: CloudNativePG performance test with EF-Series (NVMe/ROCE) (this post)
Introduction
In the first post, I didn't have time to evaluate the performance of CPNG with SANtricty.
I still don't, but at least I've done a worst-case scenario test with NVMe/RoCE using my IBM Block CSI driver. This is a baseline without any optimization, so it's hard to do worse than this.
Environment
- Kubernetes 1.36.1
- IBM Block CSI driver with SANtricity patch 1.13.2
- PostgreSQL 18
- CNPG 1.29.1
- OS: Ubuntu 24.04.4 LTS
- Host system (for CNPG on Kubernetes and PostgreSQL
pgbenchon host): dual-CPU Xeon Silver server from last decade - EF600 (equivalent of today's entry-level E-Series flash system, EF-Series EF50) with 14 disks in DDP storage pool
$ cat /proc/cpuinfo
processor       : 0
vendor_id       : GenuineIntel
cpu family      : 6
model           : 85
model name      : Intel(R) Xeon(R) Silver 4110 CPU @ 2.10GHz
stepping        : 4
microcode       : 0x2007006
cpu MHz         : 799.998
cache size      : 11264 KB
physical id     : 0
The tests is the usual pgbench test and the DB was much larger than server RAM.
No tuning of any kind was performed. Everything (tables, indexes, log) was on one 256 GiB PVC. The volume had the least optimal setup for a DB - RAID 6 on DDP. It's hard to imagine what else could be done to make results worse.
$ kubectl get nodes
NAME   STATUS   ROLES           AGE    VERSION
h2     Ready    control-plane   100d   v1.36.1

$ kubectl get pod,pvc,svc -n cnpg-backup
NAME                    READY   STATUS    RESTARTS   AGE
pod/cluster-example-1   1/1     Running   0          3h35m

NAME                                      STATUS   VOLUME                                     CAPACITY   ACCESS MODES   STORAGECLASS                   VOLUMEATTRIBUTESCLASS   AGE
persistentvolumeclaim/cluster-example-1   Bound    pvc-2f2fd4a2-0d6c-4dee-8383-a4f59ec0e020   256Gi      RWO            demo-storageclass-santricity   <unset>                 3h35m

NAME                               TYPE        CLUSTER-IP       EXTERNAL-IP   PORT(S)          AGE
service/cluster-example-nodeport   NodePort    10.110.252.11    <none>        5432:31432/TCP   3h35m
service/cluster-example-r          ClusterIP   10.111.215.116   <none>        5432/TCP         3h35m
service/cluster-example-ro         ClusterIP   10.98.63.170     <none>        5432/TCP         3h35m
service/cluster-example-rw         ClusterIP   10.109.63.158    <none>        5432/TCP         3h35m
What was different
Compared to the first CNPG post:
- I ran just one instance (there was no replica DB)
Observations
How many times have we seen poor performance in such scenarios (no tuning, single volume, RAID 6-ish)? I've seen plenty.
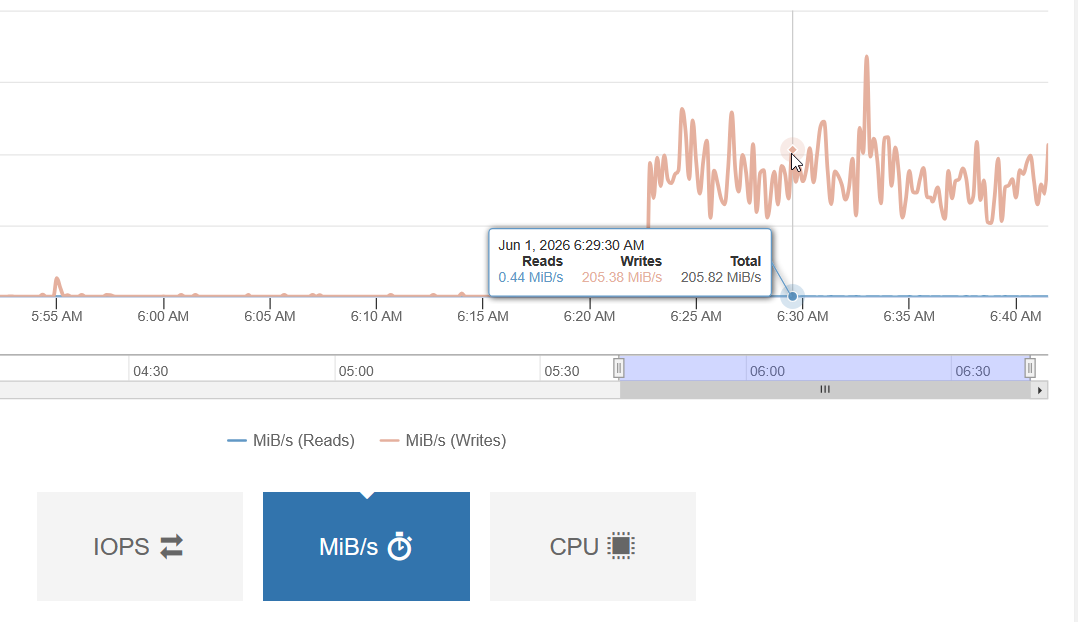
Well, here it wasn't that bad - over 200 MB/s and that's with PostgreSQL client and server sharing the same old box (and yet utilizing just 20% of CPU).
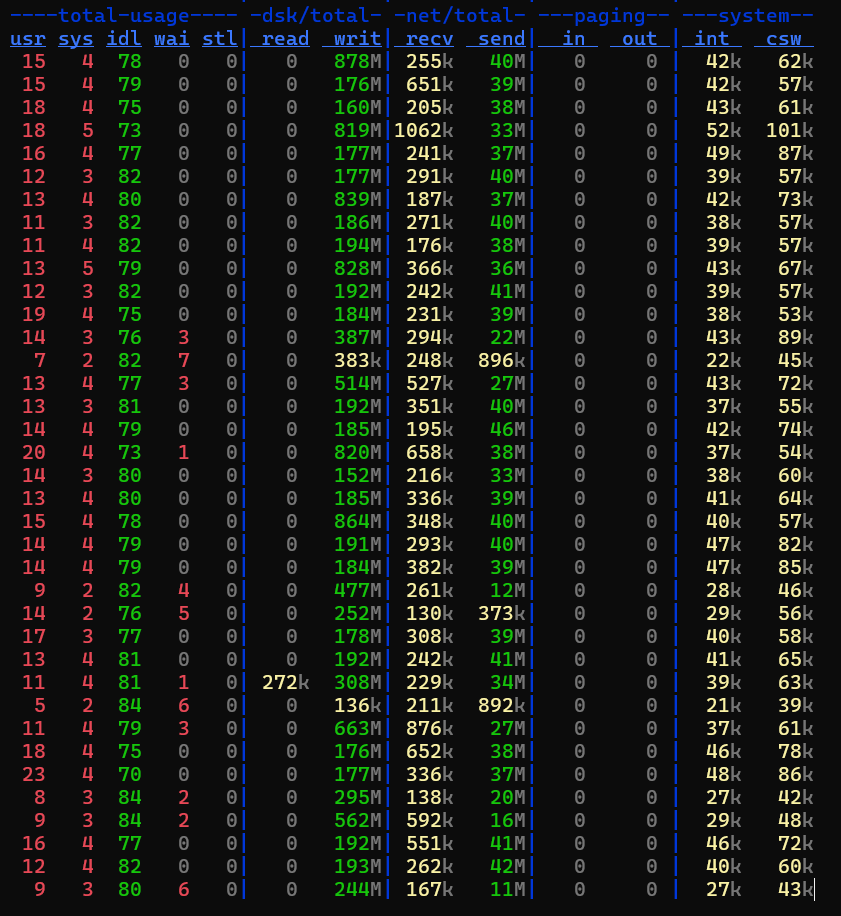
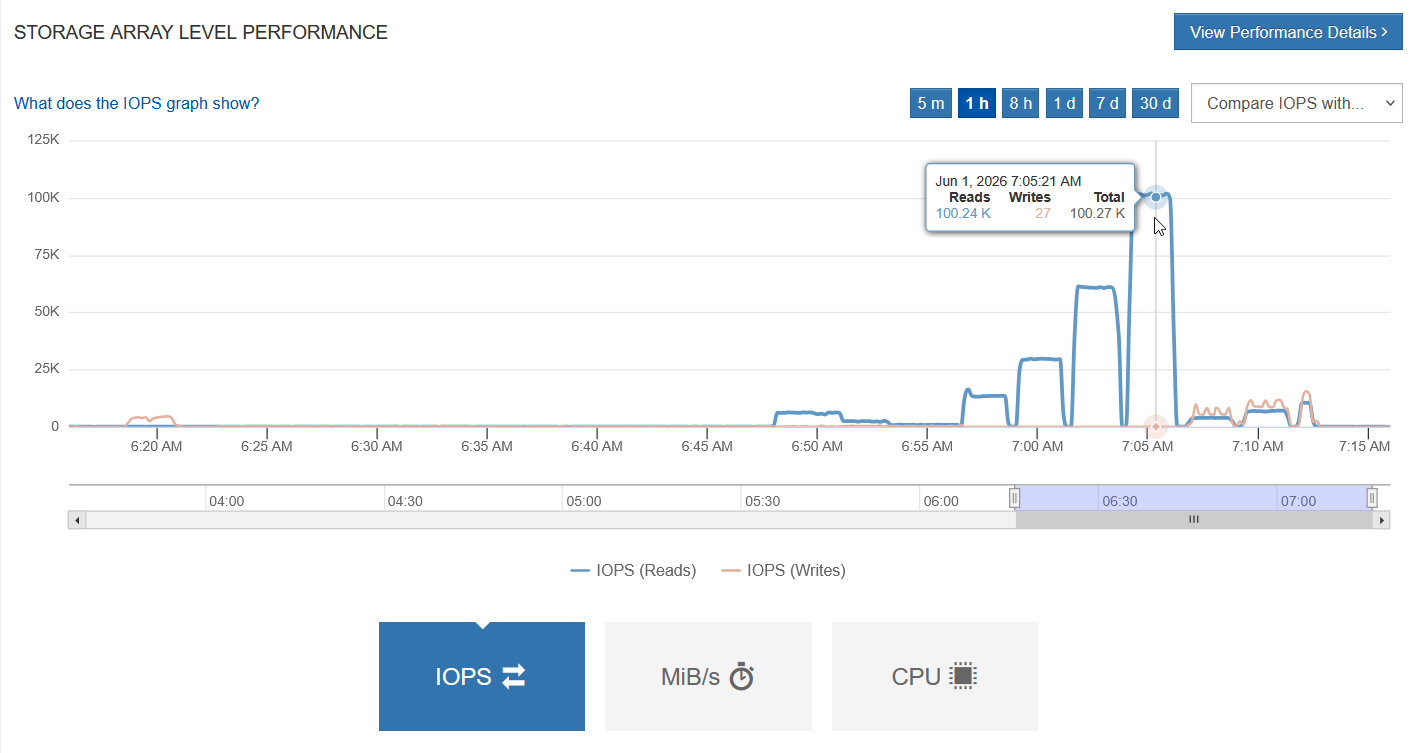
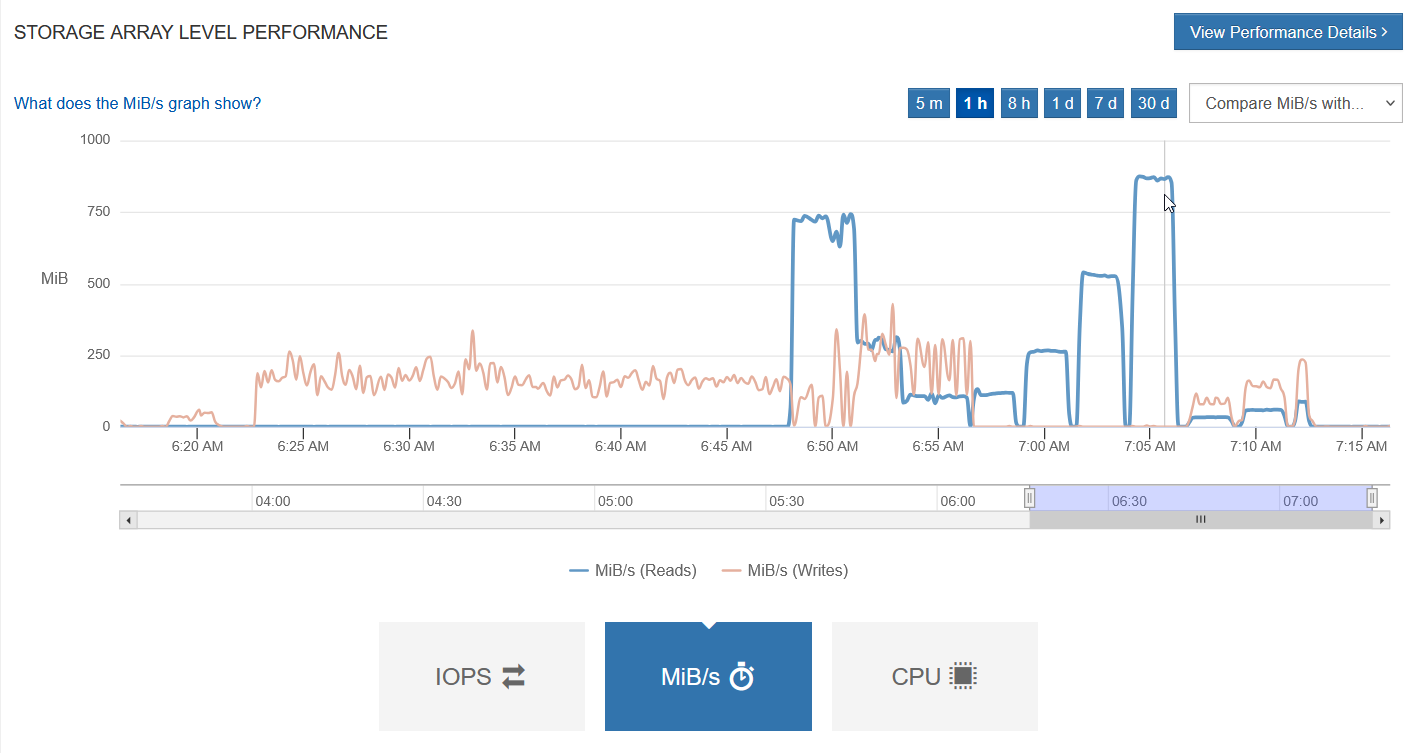
E-Series' performance monitoring dashboard reflected these dstat figures.
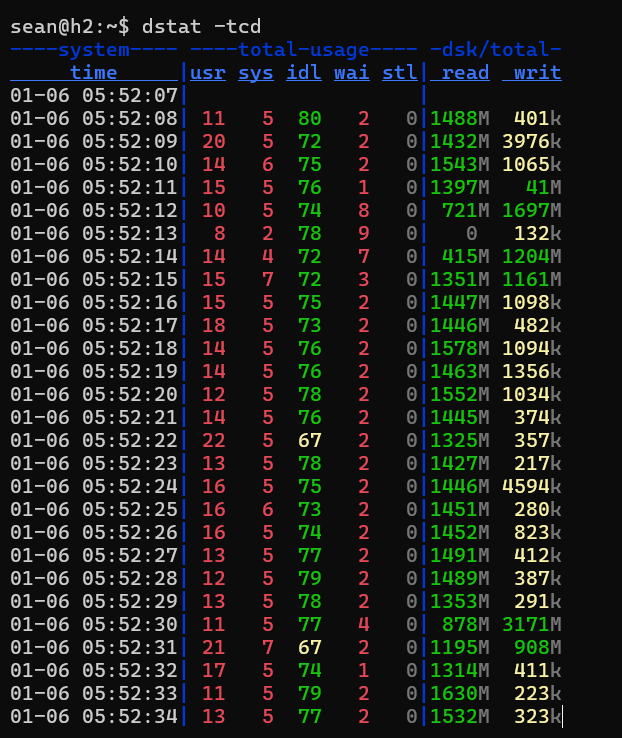
SELECT easily went over 1.5 GB/s at times.
Kubernetes added some overheads, approximately 2 vCPUs, and other workloads were consuming some CPU and RAM as well.
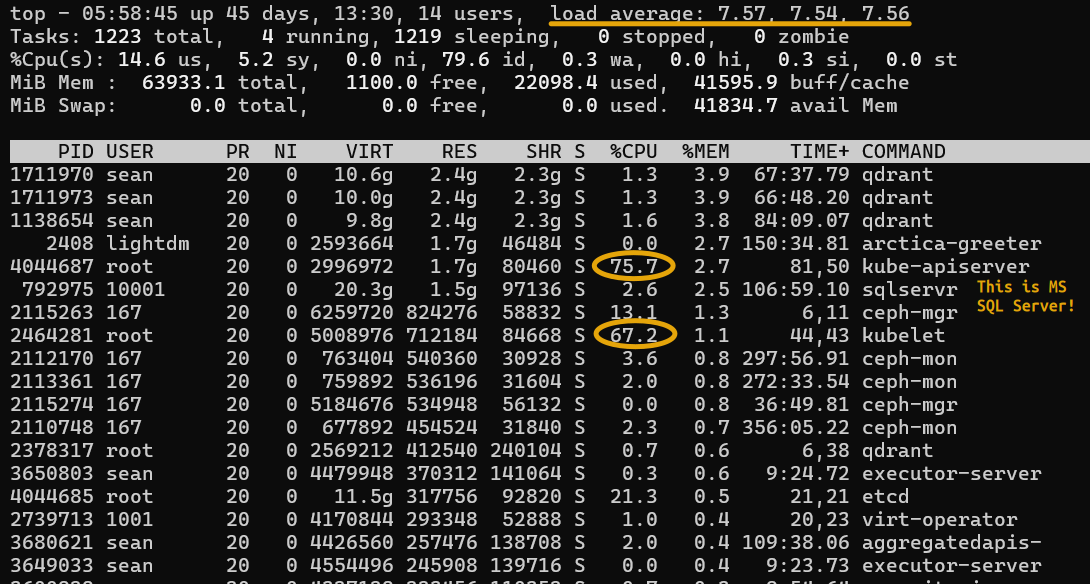
Only at the high client count (32) did we notice significant CPU utilization.
$ top
top - 09:02:22 up 45 days, 16:34,  9 users,  load average: 29.79, 21.65, 15.59
Tasks: 1230 total,  23 running, 1207 sleeping,   0 stopped,   0 zombie
%Cpu(s): 39.7 us, 25.3 sy,  0.0 ni, 11.3 id, 13.2 wa,  0.0 hi, 10.6 si,  0.0 st
MiB Mem :  63933.1 total,    654.6 free,  21550.8 used,  42884.5 buff/cache
MiB Swap:      0.0 total,      0.0 free,      0.0 used.  42382.3 avail Mem

    PID USER      PR  NI    VIRT    RES    SHR S  %CPU  %MEM     TIME+ COMMAND
   2408 lightdm   20   0 2598160   1.7g  28776 S   0.3   2.7 151:17.70 arctica-greeter
4044687 root      20   0 2996972   1.6g  34916 S 134.0   2.5     85,10 kube-apiserver
 792975 10001     20   0   20.3g   1.5g  27620 S   1.6   2.4 111:33.76 sqlservr
1711973 sean      20   0   10.0g   1.0g 917076 S   1.3   1.6  69:50.80 qdrant
1711970 sean      20   0   10.6g   1.0g 887392 S   1.3   1.6  70:42.34 qdrant
2115263 167       20   0 6262792 818328  50808 S   0.7   1.2      6,16 ceph-mgr
1138654 sean      20   0    9.8g 693152 550796 S   1.6   1.1  87:50.77 qdrant
2464281 root      20   0 5075112 675324  35140 S  32.7   1.0     46,34 kubelet
2112170 167       20   0  767524 540380  26700 S   1.0   0.8 301:39.04 ceph-mon
2113361 167       20   0  761956 533340  27364 S   0.7   0.8 276:03.80 ceph-mon
2115274 167       20   0 5184676 527616  48800 S   0.3   0.8  37:15.25 ceph-mgr
2110748 167       20   0  677892 450336  27316 S   1.0   0.7 360:24.49 ceph-mon
2739713 1001      20   0 4171100 255268  13748 S   3.9   0.4     20,32 virt-operator
4044685 root      20   0   11.5g 229448  36076 S  16.7   0.4     22,07 etcd
2378317 root      20   0 2569212 202304  29844 S   0.7   0.3      6,40 qdrant
3680621 sean      20   0 4426560 186568  70396 S   0.0   0.3 115:31.71 aggregatedapis-
2739764 1001      20   0 4092140 181792  13108 S   0.0   0.3 183:49.86 virt-operator
   1851 root      20   0   13.1g 175016  27376 S   3.3   0.3     75,23 containerd
4044252 root      20   0 1456644 170072  16876 S   3.3   0.3      8,09 kube-controller
2743225 1001      20   0 4097000 164952   9324 S   0.0   0.3 127:55.52 virt-api
3452183 26        20   0  226560 151336 147692 D  46.4   0.2   0:37.00 postgres
3452185 26        20   0  226560 151336 147692 R  47.4   0.2   0:37.37 postgres
3452197 26        20   0  226560 151304 147660 R  45.1   0.2   0:35.59 postgres
3452171 26        20   0  226560 151272 147628 R  46.1   0.2   0:36.07 postgres
3452180 26        20   0  226560 151228 147584 R  45.8   0.2   0:35.58 postgres
3452195 26        20   0  226560 151212 147568 R  45.8   0.2   0:35.95 postgres
3452174 26        20   0  226560 151208 147564 R  47.1   0.2   0:37.56 postgres
3452181 26        20   0  226560 151204 147560 D  46.1   0.2   0:36.55 postgres
3452184 26        20   0  226560 151204 147560 R  45.8   0.2   0:35.61 postgres
3452200 26        20   0  226560 151172 147528 R  46.4   0.2   0:36.41 postgres
3452201 26        20   0  226560 151172 147528 R  46.1   0.2   0:36.22 postgres
3452173 26        20   0  226560 151164 147520 R  47.7   0.2   0:37.36 postgres
3452175 26        20   0  226560 151164 147520 D  47.7   0.2   0:37.78 postgres
3452176 26        20   0  226560 151164 147520 R  47.4   0.2   0:37.21 postgres
...
SELECT workload from one particular run:
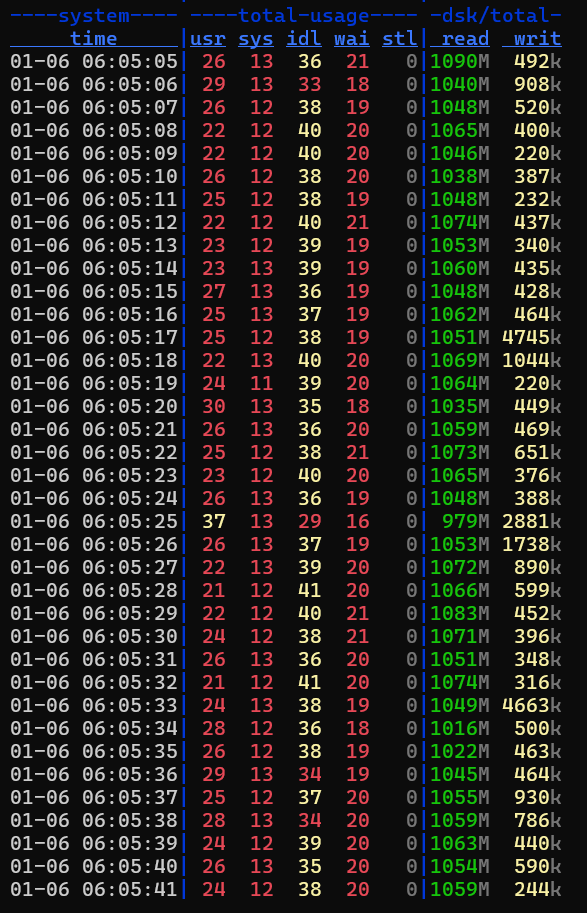
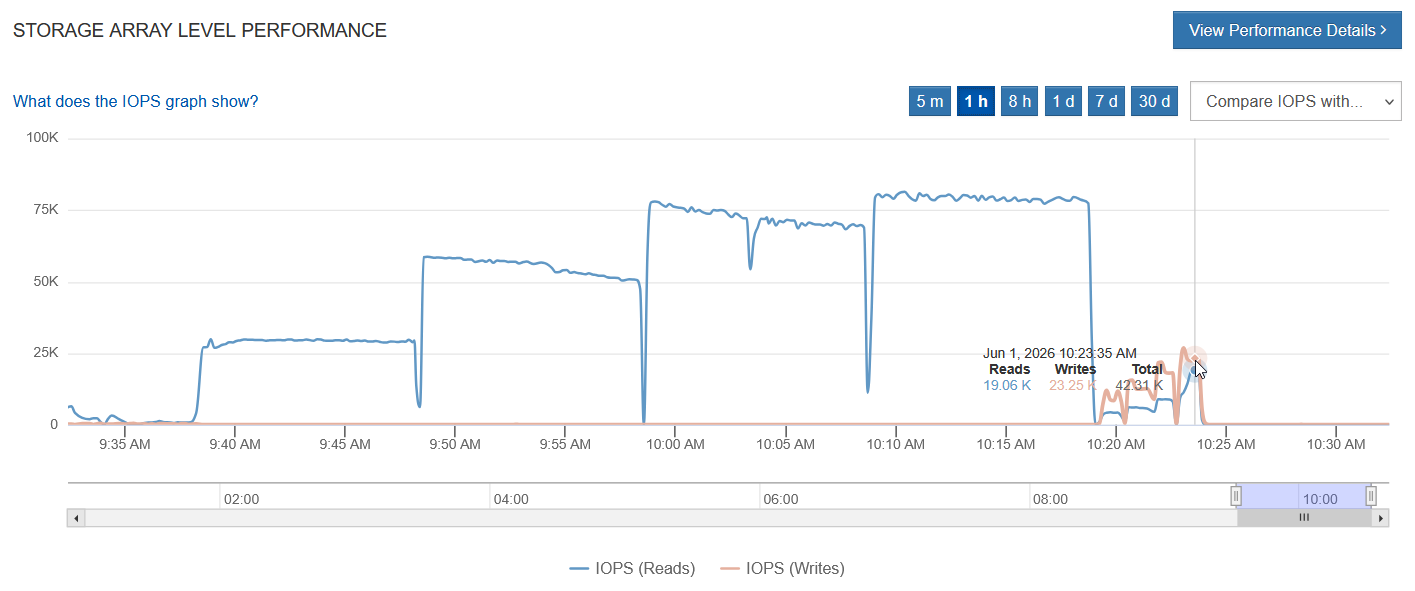
At the same time, at approximately 6:05am local time, the following IOPS (not MiB/s) were observed on E-Series:
The same in MiB/s:
The scaling from 4 -> 8 -> 16 -> 32 looked nice, and still left some CPU resources unused on this 2 x 16 cores on this system.
Some of the results:
| Scale | Type | Clients | Duration (s) | TPS | WAL Gen (MB) | Log Dir |
|---|---|---|---|---|---|---|
| 10 | RO | 4 | 60 | 36500 | 0.00 | logs-1780291115 |
| 10 | RO | 8 | 60 | 69119 | 0.00 | logs-1780291115 |
| 10 | RW | 4 | 60 | 4053 | 230.64 | logs-1780291115 |
| 10 | RW | 8 | 60 | 7965 | 453.95 | logs-1780291115 |
| 10000 | RO | 4 | 120 | 7888 | 0.00 | logs-1780291507 |
| 10000 | RO | 8 | 120 | 16643 | 0.00 | logs-1780291507 |
| 10000 | RO | 8 | 601 | 18543 | 6.65 | logs-1780297634 |
| 10000 | RO | 8 | 601 | 19385 | 6.64 | logs-1780301079 |
| 10000 | RO | 16 | 120 | 35029 | 0.00 | logs-1780291507 |
| 10000 | RO | 16 | 602 | 43970 | 8.00 | logs-1780301079 |
| 10000 | RO | 32 | 121 | 59531 | 0.00 | logs-1780291507 |
| 10000 | RO | 32 | 602 | 73844 | 0.00 | logs-1780301079 |
| 10000 | RO | 64 | 603 | 88469 | 0.00 | logs-1780301079 |
| 10000 | RW | 4 | 120 | 2284 | 4158.05 | logs-1780291507 |
| 10000 | RW | 8 | 120 | 4051 | 7293.22 | logs-1780291507 |
| 10000 | RW | 8 | 60 | 4171 | 3788.87 | logs-1780301079 |
| 10000 | RW | 16 | 60 | 6225 | 5603.27 | logs-1780301079 |
| 10000 | RW | 32 | 60 | 9444 | 8376.17 | logs-1780301079 |
| 10000 | RW | 64 | 60 | 12212 | 10585.94 | logs-1780301079 |
The pgbench wrapper scripts I used for this came from here and were adjusted to work with CNPG.
I ran them like this:
$ CNPG_SECRET_NAME=eseries-auth \
  CNPG_NAMESPACE=cnpg-backup \
  CNPG_CLUSTER=cluster-example \
  RESET_BENCH_DB=0 \
  BENCH_DB=test \
  CNPG_CONNECTION_MODE=nodeport \
  PGHOST=1.2.3.4 \
  PGPORT=31432 \
  PGUSER=eseries \
  PGPASSWORD=eseries \
  PGDATABASE=test \
  SCALES="10000" \
  CLIENTS_LIST="8 16 32 64" \
  DURATION_RO=600 \
  DURATION_RW=60 \
  SLEEP_BETWEEN_RUNS=10 \
  SLEEP_BETWEEN_PHASES=10 \
  ./run-remote.sh
The tests that are more representative of performance under stress are those with scale 10000 (>100 GiB database size, on this system with 64 GiB RAM and none of the noise removed - you can see above, I had a multi-instance Qdrant cluster, MS SQL Server, Ceph on Kubernetes, KubeVirt and everything else running at the same time).
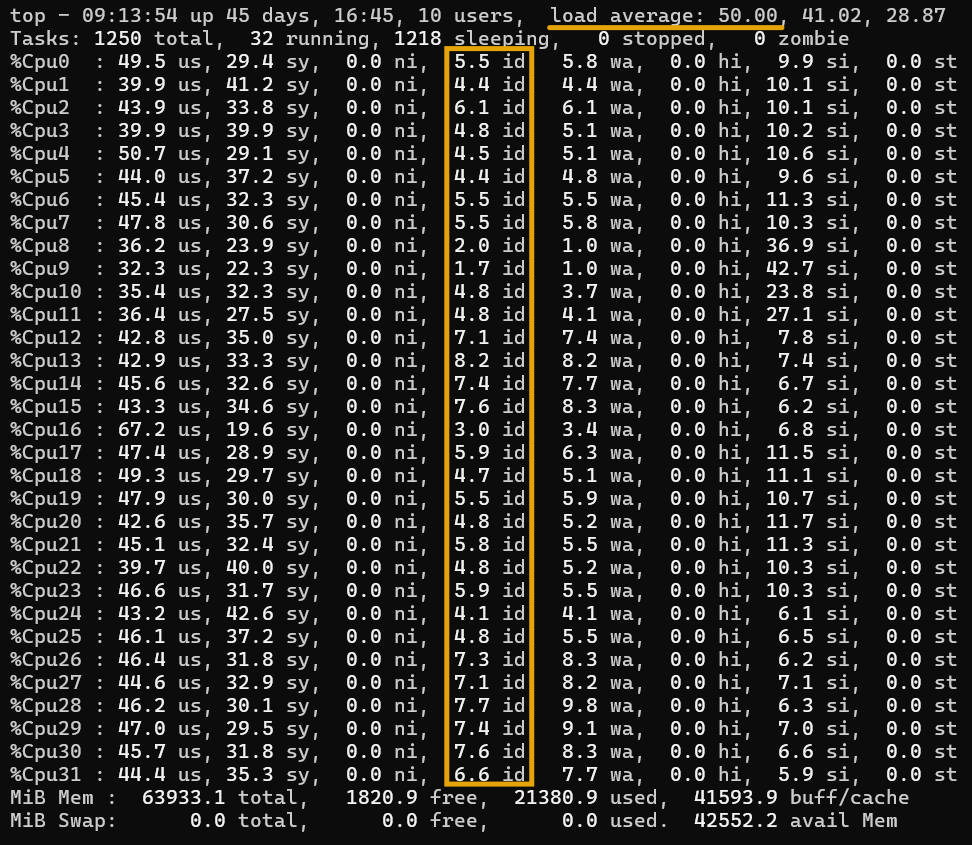
Ultimately, at 32 clients, server CPU limits started to became visible, so I couldn't see scalability beyond 32 clients on this server. Appendix A has some examples of how maxed out the CPUs were during tests with 64 clients.
Conclusion
This "worst case" setup yielded very nice results.
We haven't even scratched the surface here. We know E-Series can do a lot better with PostgreSQL. But even this casual test shows that - for most users - there's no need to tune anything if you use EF-Series.
CNPG gives you best practices out of box. It takes 60 seconds to deploy and it comes with HA, backup integration (Velero and Kasten (see Post One in this series), native backup to S3 (Post Two)) and few other nice things.
E-Series gives you fantastic performance without any tuning effort (and not just for Postgres databases). But E-Series CSI drivers are the only reason integrations like this are now possible and almost effortless; without them, we couldn't use CNPG and we'd be limited to DIY efforts with VMs (there isn't even a Docker Compose driver for SANtricity, in case you didn't get the memo).
Appendix A: test with 64 clients and Postgres on the same node
That test with 64 clients maxed out the CPUs, but the performance was still remarkably stable.
MiB/s during read-only run - 645 MiB/s:
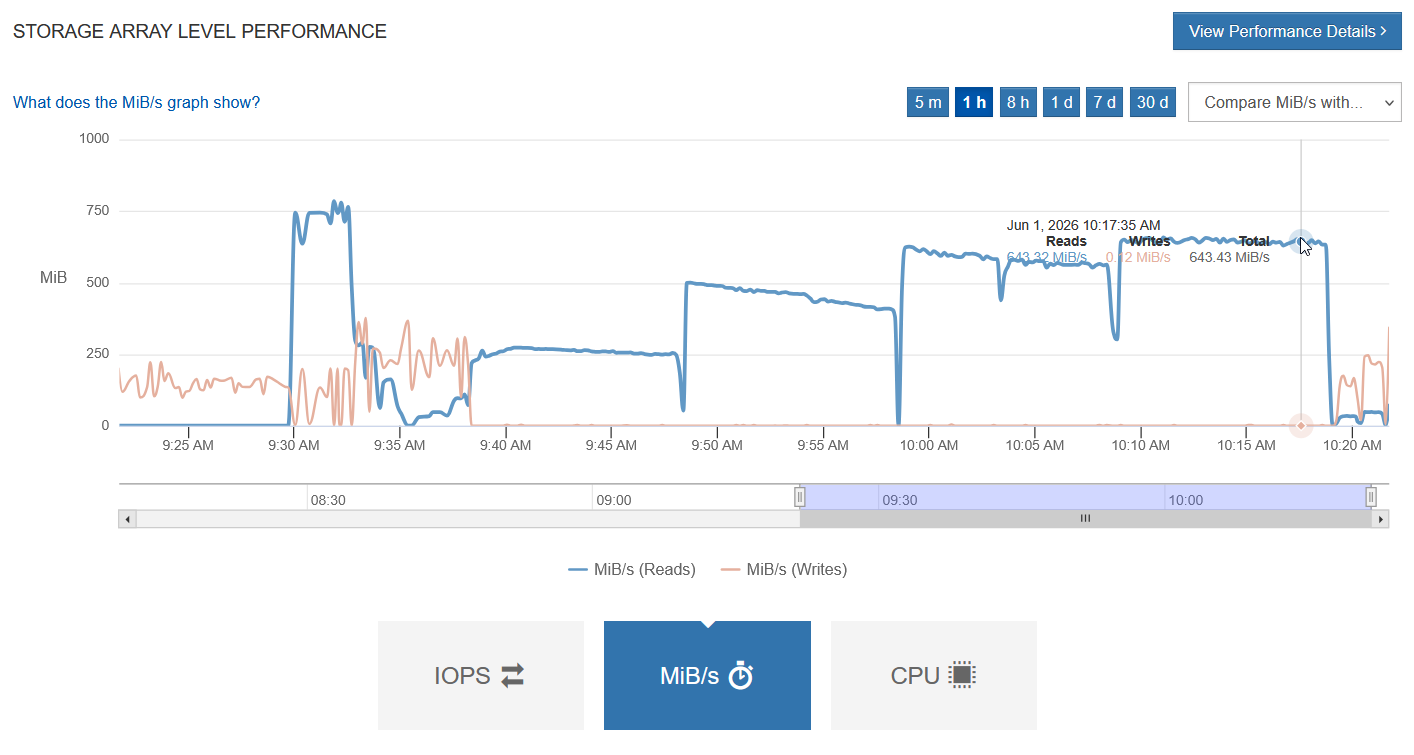
MiB/s during read-write run - 638 MiB/s (blue=reads):
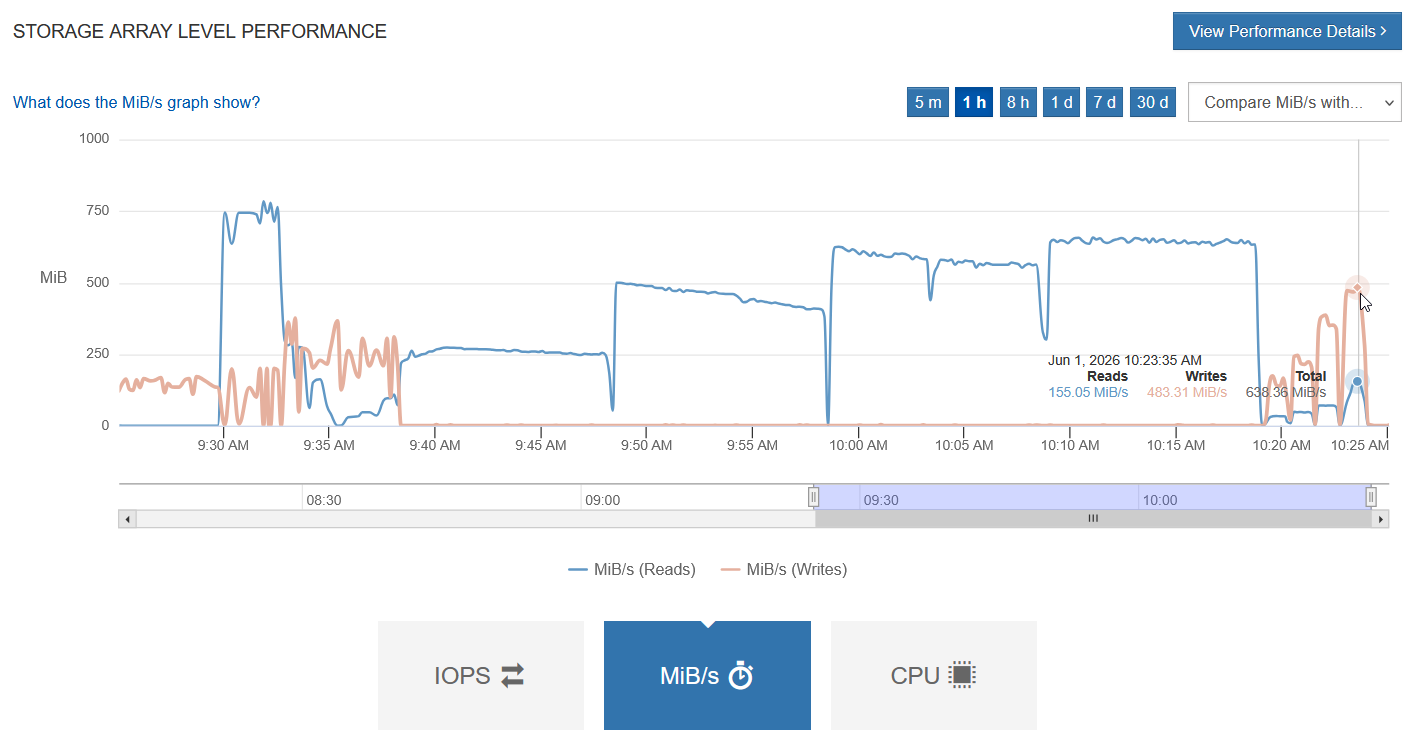
IOPS during read-only run - 80K:
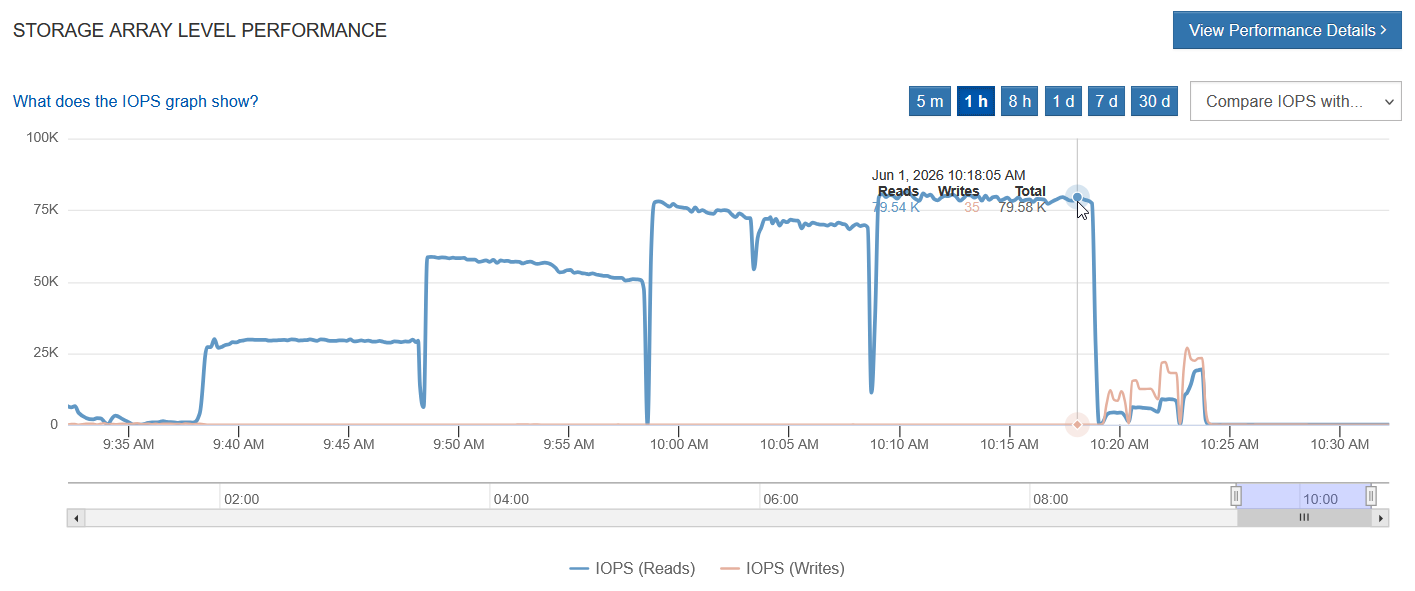
IOPS during read-write run - 42K (blue=reads):