Achieving Full Stripe Width Acceleration (FSWA) on SANtricity
Introduction
FSWA writes an entire stripe to storage, avoiding RAID 6 stripe re-write penalty. If your workload is FSWA-ish enough, you can get more out of E-Series write performance-wise.
On SANtricity, FSWA seems to be available on RAID 6 volume groups (not RAID 5, but I haven't tried to make sure of that).
So, if possible, we'd like to generate writes that end up as FSWA writes.
Funny enough, the UI (and API, as we shall see shortly) makes sure this isn't easy to see, even in the case you get smart and try to make use of this capability.
Fortunately, E-Series is often more than fast enough regardless, but in a minority of situations we may still want to explore FSWA.
Evaluate FSWA
My environment:
- Ubuntu 26.04 LTS
- NVMe/RoCE (this actually matters, as SCSI may be different)
- EF600
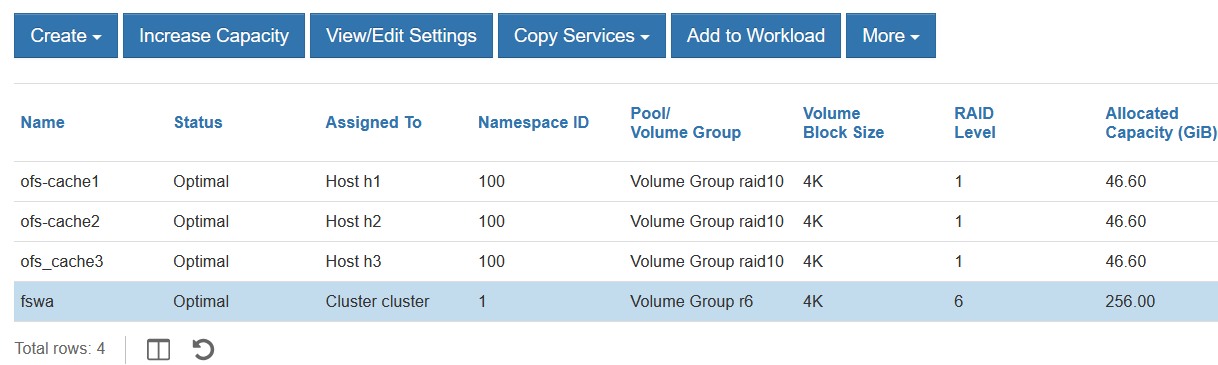
We create a RAID 6 disk group using 10 disks (8D2P).
On it, we create a volume.
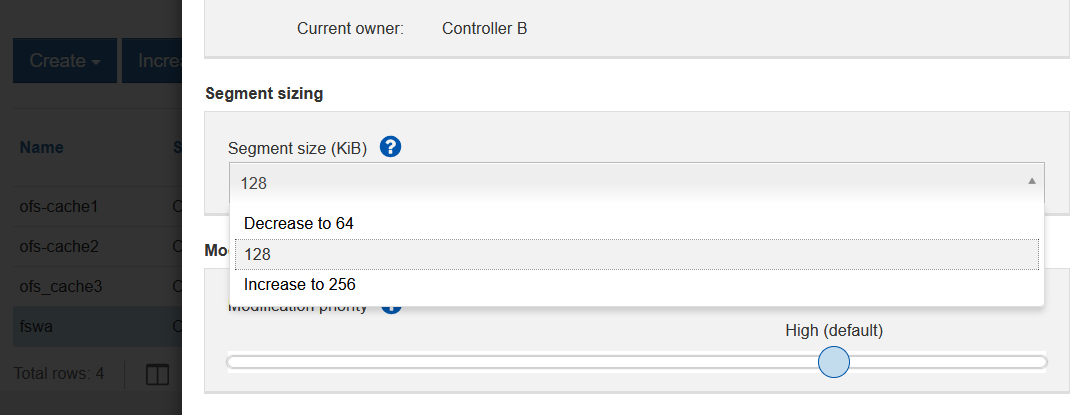
For segment size, I used the default (128 KiB on SANtricity 11.95), but I think any will work; you should pick one that's good for the application.
With R6 (8+2), 128 KiB * 8 disks equals 1 MiB, so this is perfect if my application writes in 1 MiB requests.
I suspect 64 KiB will work as well, especially if you have databases that at least sometimes write in 512 KiB requests, or OS can group them to be 512 KiB or more, that would result in FSWA writes as well.
I then present this LUN to a host, discover NVMe targets and connect to it.
Readers of this blog know I don't partition devices unless I absolutely have to. I just format my disk with mfks.xfs /dev/nvme... and mount it to /fio.
Now with FIO, I also don't try too hard: I run just 1 job, queue depth 1, and request size 1 MiB (this is really the only place I try).
fio --thread --name=1 --time_based --runtime=300 --rw=write --directory=/fio/ --size=10g --nrfiles=1 -numjobs=1 --iodepth=1 -bs=1024k
1: (g=0): rw=write, bs=(R) 4096B-4096B, (W) 4096B-4096B, (T) 4096B-4096B, ioengine=psync, iodepth=1
fio-3.41
,,,
Now I use the API to check. You can find FSWA keys in several places, but this is the one where I checked: GET /analyzed/controller-statistics?statisticsFetchTime=30
{
  "statistics": [
    {
      "observedTime": "2026-08-06T17:38:07.000+00:00",
      "observedTimeInMS": "1786037887000",
      "sourceController": "070000000000000000000001",
      "readIOps": 0,
      "writeIOps": 0,
      "otherIOps": 0,
      "combinedIOps": 0,
      "readThroughput": 0,
      "writeThroughput": 0,
      "combinedThroughput": 0,
      "readResponseTime": 0,
      "readResponseTimeStdDev": 0,
      "writeResponseTime": 0,
      "writeResponseTimeStdDev": 0,
      "combinedResponseTime": 0,
      "combinedResponseTimeStdDev": 0,
      "averageReadOpSize": 0,
      "averageWriteOpSize": 0,
      "readOps": 0,
      "writeOps": 0,
      "readPhysicalIOps": 0,
      "writePhysicalIOps": 0,
      "controllerId": "070000000000000000000001",
      "cacheHitBytesPercent": 0,
      "randomIosPercent": 0,
      "mirrorBytesPercent": 0,
      "fullStripeWritesBytesPercent": 0,
      "maxCpuUtilization": 42,
      "maxCpuUtilizationPerCore": [
        42,
        1,
        1,
        1,
        1,
        1,
        1,
        1,
        1,
        1,
        1
      ],
      "cpuAvgUtilization": 4.7272727272727275,
      "cpuAvgUtilizationPerCore": [
        42,
        1,
        1,
        1,
        1,
        1,
        1,
        1,
        1,
        1,
        1
      ],
      "cpuAvgUtilizationPerCoreStdDev": [
        0,
        0,
        0,
        0,
        0,
        0,
        0,
        0,
        0,
        0,
        0
      ],
      "raid0BytesPercent": 0,
      "raid1BytesPercent": 0,
      "raid5BytesPercent": 0,
      "raid6BytesPercent": 0,
      "ddpBytesPercent": 0,
      "readHitResponseTime": 0,
      "readHitResponseTimeStdDev": 0,
      "writeHitResponseTime": 0,
      "writeHitResponseTimeStdDev": 0,
      "combinedHitResponseTime": 0,
      "combinedHitResponseTimeStdDev": 0,
      "maxPossibleBpsUnderCurrentLoad": 181757808000,
      "maxPossibleIopsUnderCurrentLoad": 8885937
    },
    {
      "observedTime": "2026-08-06T17:38:07.000+00:00",
      "observedTimeInMS": "1786037887000",
      "sourceController": "070000000000000000000001",
      "readIOps": 0.03,
      "writeIOps": 532.17,
      "otherIOps": 0,
      "combinedIOps": 532.2,
      "readThroughput": 0.00012715657552083334,
      "writeThroughput": 502.79828389485675,
      "combinedThroughput": 502.7984110514323,
      "readResponseTime": 0.052500000000000005,
      "readResponseTimeStdDev": 0.037239092362730854,
      "writeResponseTime": 2.4673290181459686,
      "writeResponseTimeStdDev": 2.2304524340464025,
      "combinedResponseTime": 2.4671802347432306,
      "combinedResponseTimeStdDev": 2.230303161934944,
      "averageReadOpSize": 4444.444444444444,
      "averageWriteOpSize": 990702.6200900715,
      "readOps": 9,
      "writeOps": 159651,
      "readPhysicalIOps": 0.013333333333333334,
      "writePhysicalIOps": 31.74666666666666,
      "controllerId": "070000000000000000000002",
      "cacheHitBytesPercent": 6.094541870202972,
      "randomIosPercent": 0.05261147055323467,
      "mirrorBytesPercent": 0,
      "fullStripeWritesBytesPercent": 89.73379023787213,
      "maxCpuUtilization": 47,
      "maxCpuUtilizationPerCore": [
        47,
        2,
        1,
        3,
        8,
        7,
        3,
        3,
        2,
        3,
        2
      ],
      "cpuAvgUtilization": 6.116666666666666,
      "cpuAvgUtilizationPerCore": [
        46.553333333333335,
        1.0366666666666666,
        1,
        1.69,
        4.283333333333333,
        4.246666666666667,
        1.6166666666666667,
        1.6266666666666667,
        1.6033333333333333,
        1.6266666666666667,
        2
      ],
      "cpuAvgUtilizationPerCoreStdDev": [
        0.49714741833314346,
        0.18794207145347333,
        0,
        0.688403951179829,
        2.876871371627326,
        2.8599222988667985,
        0.550504818830458,
        0.5720916787446646,
        0.5409764833664729,
        0.5662351298022953,
        0
      ],
      "raid0BytesPercent": 0,
      "raid1BytesPercent": 0,
      "raid5BytesPercent": 0,
      "raid6BytesPercent": 99.99997471022726,
      "ddpBytesPercent": 0,
      "readHitResponseTime": 0.01225,
      "readHitResponseTimeStdDev": 0.010568230693924124,
      "writeHitResponseTime": 3.265565203695926,
      "writeHitResponseTimeStdDev": 3.265565203695926,
      "combinedHitResponseTime": 3.264199412258606,
      "combinedHitResponseTimeStdDev": 3.264199395426508,
      "maxPossibleBpsUnderCurrentLoad": 13808176000,
      "maxPossibleIopsUnderCurrentLoad": 725960
    }
  ],
  "tokenId": null
}
fullStripeWritesBytesPercent is 89% and I've seen it reach 91% while FIO was running. Notice it's non-0 only on Controller B, which is where our fswa LUN is.
I had some small amount of I/O going on elsewhere (Kafka from yesterday's post), so either that or something else shaved off around 10%, but 90% is good enough for me.
Where you may not find anything useful:
GET /analysed-volume-statistics- sometimes gives ridiculous result even after 3 minutes of running:"fullStripeWritesBytesPercent": -1. It's puzzling that I've seen-1,0and what looked like valid values in this output while running different tests.
There may be several other API responses where you may see ridiculous figures (0 or -1) for a volume that's actually working correctly. "Contact your NetApp representative".
Related to this, EPA already collects FSWA stats, but I also don't know if those are good - it collects what it gets from the API.
Kafka and FSWA
In yesterday's post, Kafka was running on a R10 disk group. Since I was already doing this, I thought to check it out on RAID 6, which I said I didn't recommend (and I still don't) for Kafka.
First, as I knew from yesterday's testing that in my setup with just one producer, I/O's are periodic and when they happen, they're usually below 1 MiB (I've seen 800-900 KiB), I first re-segmented this RAID 6 disk group to use 64 KiB rather than the default (128 KiB) RAID segment size.
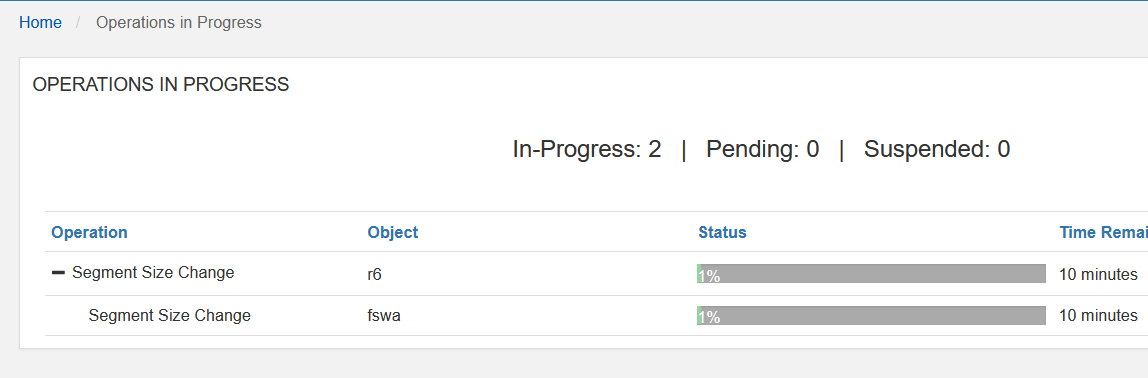
This is done online but can take forever on a NL-SAS group made of giant disks, of course. It took minutes here with small NVMe SSDs.
Then I re-ran the same producer test to generate 45 million records, and let OS flush IO as it did yesterday.
In SANtricity performance monitor, we can see clearly (although those are averaged, actually, but I saw the same in OS with iostat, it's just that this output is easier to look at) that 100 MiB write workload takes over 100 I/O requests. Which means those aren't 1 MiB large (on average).
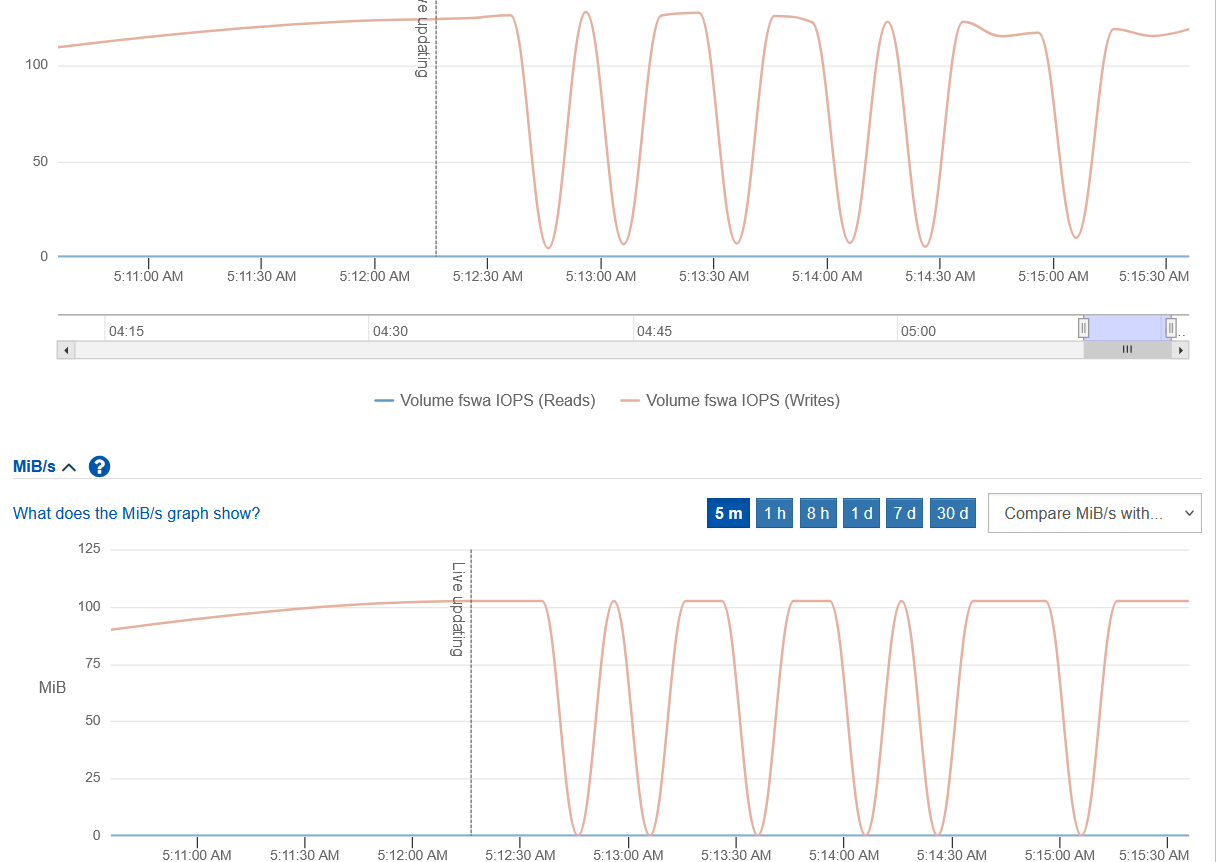
But our FSWA now needs just 512 KiB write requests (64 KiB segment size * 8) and as I looked at the API metrics, they did increment (even for individual volume, which didn't work correctly just 30 minutes ago).
GET /volume-statistics?usecache=false:
{
  "observedTime": "2026-08-07T05:30:57.000+00:00",
  "observedTimeInMS": "1786080657000",
  "lastResetTime": "2026-08-06T19:52:09.000+00:00",
  "lastResetTimeInMS": "1786045929000",
  "sourceController": "070000000000000000000001",
  "volumeGroupId": "040000006D039EA0004939FC000007326A74A286",
  "controllerId": "070000000000000000000002",
  "volumeId": "020000006D039EA000493A03000005C76A74A490",
  "arrayId": "1",
  "arrayWwn": "36303030373736303030373760A3F76E",
  "volumeGroupWwn": "6D039EA0004939FC000007326A74A286",
  "volumeName": "fswa",
  "volumeWwn": "6D039EA000493A03000005C76A74A490",
  "workloadId": "4200000002000000000000000000000000000000",
  "readOps": 168,
  "readHitOps": 0,
  "readHitBytes": 0,
  "readTimeTotal": 15301,
  "readHitTimeTotal": 0,
  "writeOps": 61645,
  "writeCacheHitOps": 5546,
  "writeTimeTotal": 235524395,
  "writeHitTimeTotal": 32767713,
  "errRedundancyChkIndeterminateReads": 0,
  "errRedundancyChkRecoveredReads": 0,
  "errRedundancyChkUnrecoveredReads": 0,
  "idleTime": 69459064392,
  "otherOps": 0,
  "otherTimeMax": 0,
  "otherTimeTotal": 0,
  "otherTimeTotalSq": 0,
  "readBytes": 688128,
  "readHitTimeMax": 0,
  "readHitTimeTotalSq": 0,
  "readTimeMax": 0,
  "readTimeTotalSq": 1578001,
  "writeBytes": 46909960192,
  "writeHitBytes": 5139615744,
  "writeHitOps": 5546,
  "writeHitTimeMax": 0,
  "writeHitTimeTotalSq": 0,
  "writeTimeMax": 0,
  "writeTimeTotalSq": 4202925267846,
  "queueDepthTotal": 2333983,
  "queueDepthMax": 0,
  "randomIosTotal": 9195,
  "randomBytesTotal": 2092367872,
  "cacheWriteWaitHitIops": 5546,
  "cacheWriteWaitHitBytes": 5139615744,
  "fullStripeWriteBytes": 52933689344,
  "totalIosShipped": 0,
  "totalBlksEvicted": 18222473,
  "cacheBlksInUse": 343,
  "prefetchHitBytes": 0,
  "prefetchMissBytes": "0",
  "flashCacheReadHitOps": 0,
  "flashCacheReadHitBytes": 0,
  "flashCacheReadHitTimeTotal": 0,
  "flashCacheReadHitTimeMax": 0,
  "flashCacheReadHitTimeTotalSq": 0
}
fullStripeWriteBytes went from close to zero to 5139615744 at one point, which was close to 5 GiB. We could check that controller FSWA percentage value to check the percentage figure, but I had some other I/O on the array so I did not try to find out the exact percentage.
In the case you wonder how RAID 6 performed compared to RAID 10, you can't really see that from Kafka as writes to disk are asynchronous. We'd have to saturate the array to know. Also, producer workload isn't the only one that matters - there are reads (from consumers), there may be log compaction, tiering, and more.
Regarding RAID 6 and FSWA, we lowered segment size to 64 KiB to get FSWA here. But, at what cost? If we had any other large sequential workloads on this RAID 6 group, they would run slower.
So, despite FSWA working for > 512 KiB writes here, it has downsides and RAID 6 itself isn't the right choice for most Kafka clusters when other (non-producer) workloads are considered.
FSWA with Versity S3/RDMA (Direct IO)
In this test (borrowed from here) we set VGW_ENABLE_O_DIRECT=true to have Versity S3 Gateway write with direct IO flag.
Volume stats before:
{
  "observedTime": "2026-08-11T10:52:38.000+00:00",
  "observedTimeInMS": "1786445558000",
  "lastResetTime": "2026-08-10T19:52:10.000+00:00",
  "lastResetTimeInMS": "1786391530000",
  "sourceController": "070000000000000000000001",
  "volumeGroupId": "040000006D039EA0004939FC000007326A74A286",
  "controllerId": "070000000000000000000002",
  "volumeId": "020000006D039EA000493A03000005C76A74A490",
  "arrayId": "1",
  "arrayWwn": "36303030373736303030373760A3F76E",
  "volumeGroupWwn": "6D039EA0004939FC000007326A74A286",
  "volumeName": "fswa",
  "volumeWwn": "6D039EA000493A03000005C76A74A490",
  "workloadId": "4200000002000000000000000000000000000000",
  "readOps": 50036,
  "readHitOps": 21725,
  "readHitBytes": 22763601920,
  "readTimeTotal": 5982628,
  "readHitTimeTotal": 169554,
  "writeOps": 52532,
  "writeCacheHitOps": 6163,
  "writeTimeTotal": 40174329,
  "writeHitTimeTotal": 5782469,
  "errRedundancyChkIndeterminateReads": 0,
  "errRedundancyChkRecoveredReads": 0,
  "errRedundancyChkUnrecoveredReads": 0,
  "idleTime": 108060562195,
  "otherOps": 0,
  "otherTimeMax": 0,
  "otherTimeTotal": 0,
  "otherTimeTotalSq": 0,
  "readBytes": 52429074432,
  "readHitTimeMax": 203,
  "readHitTimeTotalSq": 1765631,
  "readTimeMax": 3825,
  "readTimeTotalSq": 2855666169,
  "writeBytes": 52517789696,
  "writeHitBytes": 6451048448,
  "writeHitOps": 6163,
  "writeHitTimeMax": 4381,
  "writeHitTimeTotalSq": 0,
  "writeTimeMax": 8547,
  "writeTimeTotalSq": 5985752658,
  "queueDepthTotal": 463000,
  "queueDepthMax": 39,
  "randomIosTotal": 41748,
  "randomBytesTotal": 345357189120,
  "cacheWriteWaitHitIops": 6163,
  "cacheWriteWaitHitBytes": 6451048448,
  "fullStripeWriteBytes": 59151220736,
  "totalIosShipped": 0,
  "totalBlksEvicted": 1489617,
  "cacheBlksInUse": 232264,
  "prefetchHitBytes": 0,
  "prefetchMissBytes": "0",
  "flashCacheReadHitOps": 0,
  "flashCacheReadHitBytes": 0,
  "flashCacheReadHitTimeTotal": 0,
  "flashCacheReadHitTimeMax": 0,
  "flashCacheReadHitTimeTotalSq": 0
}
Let's write 1,000 5 MiB objects using Versity's S3/RDMA test client:
./cuobjtest -access admin -bucket rdma -endpoint http://192.168.1.11:7070 -n 1000 -secret secret -size 5MiB
Volume stats after:
{
  "observedTime": "2026-08-11T10:56:00.000+00:00",
  "observedTimeInMS": "1786445760000",
  "lastResetTime": "2026-08-10T19:52:10.000+00:00",
  "lastResetTimeInMS": "1786391530000",
  "sourceController": "070000000000000000000001",
  "volumeGroupId": "040000006D039EA0004939FC000007326A74A286",
  "controllerId": "070000000000000000000002",
  "volumeId": "020000006D039EA000493A03000005C76A74A490",
  "arrayId": "1",
  "arrayWwn": "36303030373736303030373760A3F76E",
  "volumeGroupWwn": "6D039EA0004939FC000007326A74A286",
  "volumeName": "fswa",
  "volumeWwn": "6D039EA000493A03000005C76A74A490",
  "workloadId": "4200000002000000000000000000000000000000",
  "readOps": 55036,
  "readHitOps": 24067,
  "readHitBytes": 25219366912,
  "readTimeTotal": 6427782,
  "readHitTimeTotal": 184843,
  "writeOps": 58172,
  "writeCacheHitOps": 6780,
  "writeTimeTotal": 44233263,
  "writeHitTimeTotal": 6280289,
  "errRedundancyChkIndeterminateReads": 0,
  "errRedundancyChkRecoveredReads": 0,
  "errRedundancyChkUnrecoveredReads": 0,
  "idleTime": 108464645746,
  "otherOps": 0,
  "otherTimeMax": 0,
  "otherTimeTotal": 0,
  "otherTimeTotalSq": 0,
  "readBytes": 57671954432,
  "readHitTimeMax": 68,
  "readHitTimeTotalSq": 1885254,
  "readTimeMax": 1009,
  "readTimeTotalSq": 2976584743,
  "writeBytes": 57777184768,
  "writeHitBytes": 7095095296,
  "writeHitOps": 6780,
  "writeHitTimeMax": 5405,
  "writeHitTimeTotalSq": 0,
  "writeTimeMax": 11720,
  "writeTimeTotalSq": 6433714365,
  "queueDepthTotal": 500201,
  "queueDepthMax": 61,
  "randomIosTotal": 43211,
  "randomBytesTotal": 356839718912,
  "cacheWriteWaitHitIops": 6780,
  "cacheWriteWaitHitBytes": 7095095296,
  "fullStripeWriteBytes": 64871202816,
  "totalIosShipped": 0,
  "totalBlksEvicted": 1653576,
  "cacheBlksInUse": 232537,
  "prefetchHitBytes": 0,
  "prefetchMissBytes": "0",
  "flashCacheReadHitOps": 0,
  "flashCacheReadHitBytes": 0,
  "flashCacheReadHitTimeTotal": 0,
  "flashCacheReadHitTimeMax": 0,
  "flashCacheReadHitTimeTotalSq": 0
}
"After" minus "before" was (64871202816-59151220736) or 5,719,982,080 bytes which is 5.455 GiB, while WriteOps increment was (58172-52532) or 5,640, which shows approximately 990 KiB average write operation. Almost all I/O from this test was FSWA.
Conclusion
It seems FSWA works "out of the box", without special "tricks", but finding a confirmation isn't easy and requires looking in the right place(s) in the API.
By default, NVMe/RoCE on SANtricity 11.9 allows 1 MiB IO requests, so that is the minimum required to achieve FSWA. Alternatively, multiple smaller requests may be merged into 1 MiB, but that's often hard to control.
Write requests that are larger that what FSWA requires should translate into multiple FSWA write requests.
128 KiB (the default) segment size for RAID 6 is the right choice in most cases. Lowering it to 64 KiB in order to "chase" FSWA isn't a good idea if you have multiple sequential workloads, but it does help if your requests are in the 512-1024 KiB range and your workload write-heavy.
FSWA is important for HPC use cases and multi-client write-heavy workloads (perhaps video surveillance or KV cache offloading for AI inferencing, for example). If you're not looking to squeeze out the last 10-20% of performance, FSWA probably shouldn't be your top priority when it comes to workload or configuration optimization.