Kafka 4 with NetApp E-Series
Introduction
I already blogged about storage layout, capacity and performance sizing for Kafka from an E-Series perspective, and there haven't been many fundamental changes in Kafka as far as storage is concerned.
- There are proprietary implementations of "diskless" Kafka (see post on AutoMQ, which isn't just a new storage engine, but a Kafka clone), which don't apply to Apache Kafka and distributions based on it
- There are new E-Series models (EF-Series EF80 and EF50, specifically) that are faster but don't impact how Kafka uses E-Series
So, nothing fundamental compared to four years ago.
If you use Kafka Streams, which is an "add-on", you may need more disk space and more Kafka performance as Streams are really a separate application with different sizing requirements.
What Kafka needs from protected storage
I say "protected storage" to exclude JBOF/JBOD where the loss of a disk causes rebuilds of lost data. There's nothing wrong with using that approach, but people who use that don't use protected storage.
People who don't want to deal software-managed RAID and unplanned downtime due to disk failures tend to use protected storage, so this post focuses Kafka on protected storage.
What do we need from it?
| Capability | Required |
|---|---|
| Storage efficiency | No, Kafka has it |
| Storage snapshots | No, Kafka has no use for them |
| Storage replication | No, Kafka does its own |
| Backup and restore | No, Kafka has replication, tiering, app backup |
| Active-Active | No, solved by in-cluster replicas and Geo-Replicator |
| Storage QoS | No, Kafka has network bandwidth, network rate and CPU quotas |
| Storage protection | Maybe, if you don't like managing physical disks* |
| Performance | Yes |
| Price | Yes |
| Availability | Yes, protected storage with no SPoF* |
The assumption, as I've mentioned, is one prefers to lessen their unplanned and planned maintenance workload and use saved time to focus on business.
Performance
As you can see in the EF post linked above, EF50 and EF80 are very fast and both can have clients directly attached (without using a switch).
Because those arrays are so fast, I still recommend right-sizing and using older arrays as long as they are available:
- 3 x EF300 in three racks is better than 1 x EF50 in a single rack. One should value availability and rack redundancy in this use case
- There's no need to fully populate multiple systems, as you can see in the very detailed NATS post. If you use RAID 10 (or even RAID 0 - see the NATS post), you can get a lot out of just 4 or 6 small 3.84 TB disks per EF300. In fact there's almost no advantage in using EF50 with 6 disks in RAID 10 when 6 disks don't max out an EF300
If you go with a "building block" pattern rather than piece-by-piece expansion, 3 x 1U servers and 1 x EF300 per rack is a good starting point. That should be enough for a bunch of Kafka brokers (assuming several CPU cores per each).
For RF2 on one or more arrays, use RAID 10. For RF3 across several, RAID 0 isn't a bad idea either, as explained in the NATS post.
Availability
Use at least RF2 to be able to recover from rack, server, filesystem, network or disk array failures.
You need at least three nodes in a highly-available cluster, which is why using two racks isn't much better than using one. I'd use either one or three racks (and storage arrays).

If you have tiering to S3 in place, start with three StorageGRID boxes, one per rack (shown at the bottom of each rack). The first two load balancers (SG1 models) should be placed one per rack in that case, so that there are two racks with NLB capability.
RAID 10 or DDP?
TFM says RAID rebuild penalty is high.
our experience has been that rebuilding the RAID array is so I/O intensive that it effectively disables the server, so this does not provide much real availability improvement.
In my experience, a lot of those software people haven't used an enterprise array in their whole life.
So, while I don't know for sure either, I'd say that is likely a nonsense blanket statement that comes from observing a low end server RAID (I made the same comment about similar nonsense in the Elasticsearch documentation before). Why?
- You can set rebuild priority on operations such as rebuilding, reconstruction and disk copy on DDP-based RAID 1 and RAID 6 volumes. If you think reconstruction impact is high, simply lower the slider to a lower priority
- Several NetApp Technical Reports (such as the one cited here, but also the one on Hadoop, etc.) demonstrated that reconstruction and rebuild impact on performance with E-Series was significantly lower than with JBODs
Now, why are we suddenly talking about DDP? DDP supports striped RAID 1 volumes, so yes, there's nothing wrong with that in single rack configurations if you prefer to consolidate. But beware:
- DDP with RAID 10 can still tolerate just one concurrent disk failure. Should the second disk fail within say 30 minutes, all Kafka RAID 1-style volumes on DDP will go down
- So if you use DDP in single rack configuration, where all Kafka servers depend on it, you should have rebuild priority set to High or Highest (and lower it if you can't take it). The impact should be tolerable because a DDP (8+ disks) with SSDs uses all disks - not just one "hot spare" - to rebuild missing strips
For three racks with DDP, you won't be able to use DDP in each rack unless you have at least 8 or more disks per each, but if that's the case, then you'd have the same resilience you get from RAID 10 with 8 or more disks (1 disk can fail at a time), but you'd be able to tolerate multiple non-concurrent disks (as long as there's leftover unused capacity beyond the sum of all LUN capacities) and reconstruct much faster.
With three racks with RAID 10 on DDP, setting rebuild priority to Low or Lowest is fine. That increases recovery time, but since you have RF2 at least (or maybe RF3), the impact of rebuilding won't be felt at all.
One DDP pool vs three RAID 10 groups in one array
Say you have a single array and need 24 disks for Kafka. What's better?
- One DDP pool across 20 disks
- Three 6-disk RAID 10 disk groups (+ 1 hot spare)
One DDP exposes you to double concurrent disk failure.
I don't know if those things really happen - I haven't heard of double disk failures on DDP with SSDs - but DDP can reconstruct from a failed disk within 60 minutes and can repeat that multiple times over a long weekend without data loss. RAID 10 can't.
But you, can lose 3 disks at the same time with RAID 10 (assuming each group loses one) and DDP can't save you from that.
If you need just controller HA and not resilience to rack failures, one DDP in a single rack is fine.
You can use DDP and create RAID 6-style volumes on it; those will tolerate two concurrent disk failures. But that's a lousy "solution" to double disk failure problem. The Kafka documentation doesn't recommend even RAID 5, let alone RAID 6, and you still have guaranteed downtime if the rack fails.
To survive concurrent double disk failures on one array:
- use multiple R10 or R0 disk groups, or
- use two DDP pools with RAID 10 volumes and RF2 (one copy on each DDP), or
- use one DDP pool with RAID 6 volumes - worst alternative, but may be okay for small Kafka clusters
Storage efficiency
I'll add a note on storage efficiency, which I marked as unnecessary in the table at the top. It's not that it's completely unnecessary, but that it doesn't buy you much and it isn't free:
- One almost always uses compression in all Kafka clients (see below)
- Re-compressing that isn't free. Yeah, sure, maybe you can eke out some extra space by doing that, but that's redoing all the CPU work on clients several times over
- Once to re-compress (if compressed) or compress (if not)
- Every time to de-compress on read, which may be 2x or 4x more requests
- For the most part one cannot both have a storage system that spreads across multiple racks and deduplicates and compresses across racks. Theoretically you could have efficiency limited to single failure domain, but in reality the entire cluster is a failure domain and no one can claim three arrays in three racks are less resilient than one
- Kafka logs aren't that big anyway. Most users have few TBs at most. You can also tier them away if you need to keep them longer than a week, for example. Read about Kafka tiering
In my Kafka post from 2022 I tried RF3 on SolidFire and saw almost 2x savings. Fine. But we still have one storage cluster, even if it's spread across three racks. If you have 50TB in Kafka storage and 50 applications that depend on Kafka, is saving 25TB worth the risk?
So, I don't see storage efficiency as a factor.
Now, regarding "one almost always uses compression" - you can see that any compression saves a lot compared to none. These are shares of each of five topics with identical data.
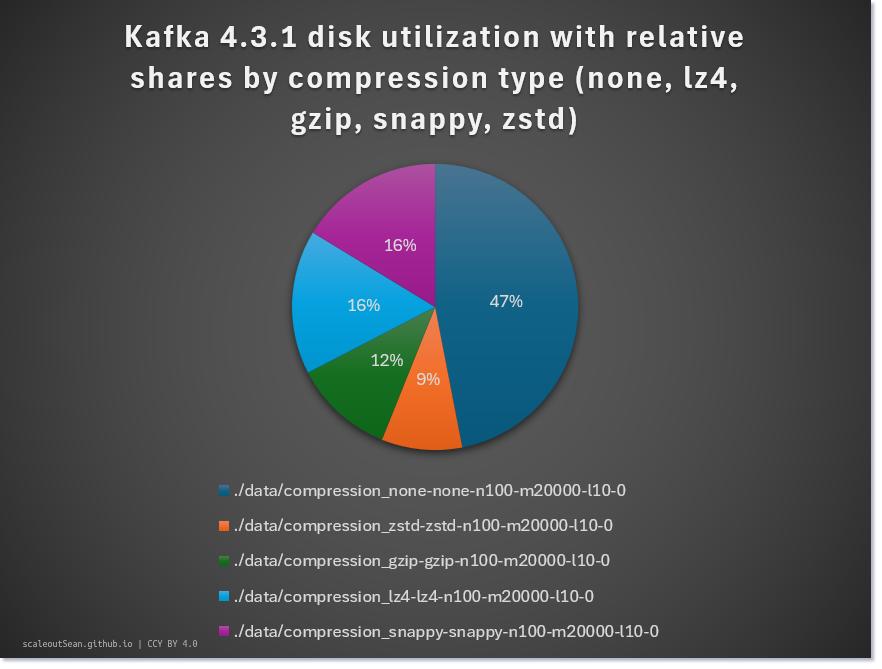
A simplistic idea is "let's see which one is the best". But that's not how it works. What is the best?
Some algorithms may use more CPU and save more with one type of messages and less with another. We should decide our criteria, pick metrics that reflect it and then test. I did a simple storage capacity-focused test.
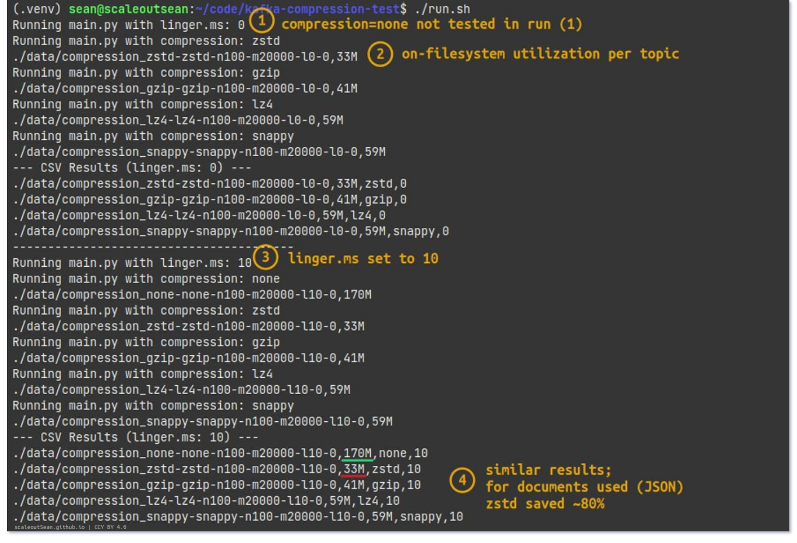
(The small break where there's no activity is a short pause between two test runs.)
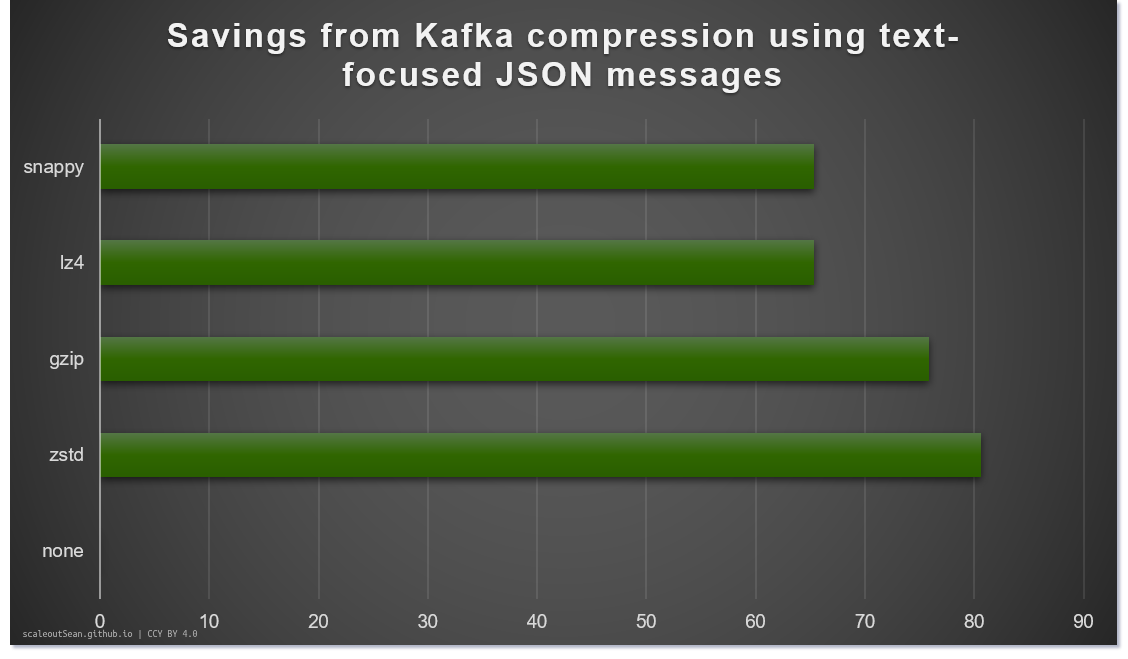
We should check topic-message payload for each major topic we have and evaluate clients' performance as well. Our approach here is very generic and superficial, but since we're focused on storage savings, in this experiment zstd saved most, yay!
Performance sizing
In the tests above, each run consisted of 20,000 JSON messages (less than 8KiB each).
Uncompressed Kafka log size was 150 MiB (20,000 x 7.9KiB).
With one producer and one broker (RF1), uncompressed writes took about 7 seconds. Let's make it simple and say 160 MiB / 8 seconds = 20 MiB/s for 2,500 of 8KiB messages. If my workload is 100K messages per second, that's 40x so 20 x 40 = 800 MB/s.
The smallest array you can get, EF300, can deliver up to 7 GB/s write. That's with large request sizes (probably 2 MiB). It's faster with reads, so let's say we can count on 5 GB/s with a single controller and 60% read.
| Workload | Requirement |
|---|---|
| Producers | 800 MiB/s |
| Add RF2 | 800 MiB/s |
| Consumers | 2,400 MiB/s |
| TOTAL | 4,000 MiB/s |
Read ratio is 60% (2,400/4,000), in this case.
This is simplistic, but it shows you could get away with a single EF300 even if one of two controllers fails.
If you wanted extra buffer, but not the fastest box: EF50 or EF600.
If you used 3 x EF300, you would have plenty of buffer. Just note that you always need enough disks to drive performance. For 5 GiB/s on a single array, you will likely need more than just 2 disks in RAID 1, for example.
I have some examples in Appendix A.
One disk vs multiple disks per node
E-Series has excellent single disk performance and given data volumes (not very large considering that there are just days of retention), you probably won't need multiple volumes.
Kafka supports specifying multiple log directories. I haven't used them, but you could look into that if you wanted to have multiple LUNs (and avoid using LVM to group them).
Capacity sizing
SANtricity v12 and v11 arrays have no efficiency features, so you can simply use a range of topics that reflect your requirements and that is how much capacity you'd need on E-Series.
On E-Series, RAID 0 gives you most usable, but as I've mentioned above, you should likely have three arrays for that. Depending on how many arrays you use and how you partition them, make sure usable capacity is sufficient for your data volume and retention.
Kafka has tiering to S3, but it still has non-insignificant limitations. If you want to save space, consider setting non-default (7d) retention such as 3 or 5 days. And you can replicate to a NL-SAS based cluster if you need to archive logs longer. There's also log compaction.
Storage provisioning
Choose any of these approaches, they all work.
- Physical (bare metal) servers
- VMs in a supported hypervisor (anti-affinity settings)
- Docker in VMs or on bare metal servers
- Kubernetes with TopoLVM CSI or static PVCs provisioned with Terraform SANtricity Provider
- There are also HA CSI drivers with dynamic provisioning, see here, although generally we don't want broker "pod failover", we want to solve this Kafka-side, with Kafka replicas.
Docker, Terraform, TopoLVM or even static PVs volumes free you from fiddling with storage. If you use RAID 10 or other protected LUNs, it all works and frees you from storage management for the most part.
Conclusion
Not much has changed: E-Series remains the best storage for Kafka brokers you can get from NetApp.
It's affordable enough to be provisioned across multiple racks, has RAID 10 and RAID 0 (both are preferred options in the Kafka documentation) and you can get RAID 10 on DDP or in classic RAID 10 groups.
Furthermore, E-Series has excellent single volume performance - that's great for brokers, but also for Kafka Streams and other Kafka-related applications.
Three entry level models should be enough for medium sized Kafka clusters, but you can scale out using the building-block approach or use the 2026 models to keep the disk array count low.
In my opinion, these are top things to avoid on external storage:
- RAID 6 and RAID 5
- Single-array, single-rack deployments in environments where many, or important, services depend on Kafka
If you're interested in Kafka and FSWA on RAID 6, also check out the next post.
Appendix A: Workload examples
- Server: Confluent Kafka 8.2.2 (one instance in Docker container) on 2-way Xeon Silver
- Client: Kafka 4.3.1 on Ubuntu 24.04 (bare metal accessing containerized broker over loopback)
- OS caching clearly impacted (helped) these results but wasn't suppressed because the workload was low anyway
There are many reasons why it's complicated even in the simple scenario, which is single client, single broker, single topic.
Kafka relies on JVM cache and also OS cache. A producer may be sending messages at whatever rate the network and CPU (both producer's and brokers) allow, but that doesn't mean we'll see any disk IO. Normally we need to wait for OS to flush dirty cache to disk. So with one producer, we can't really see much.
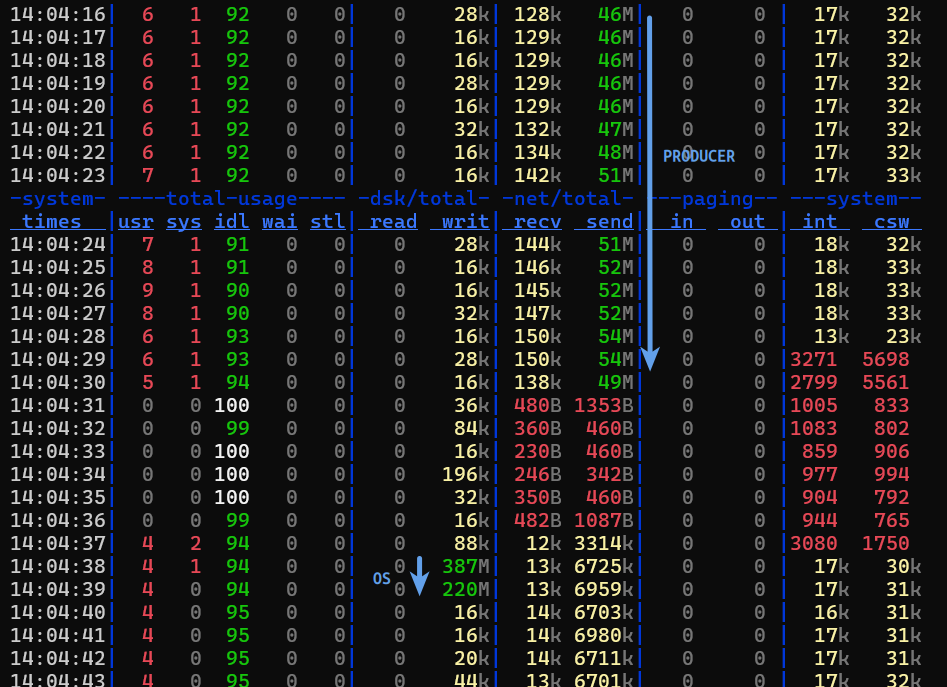
On storage, we will likely see spikes as well, unless we have a bunch of producers making this flushing to disk constant.
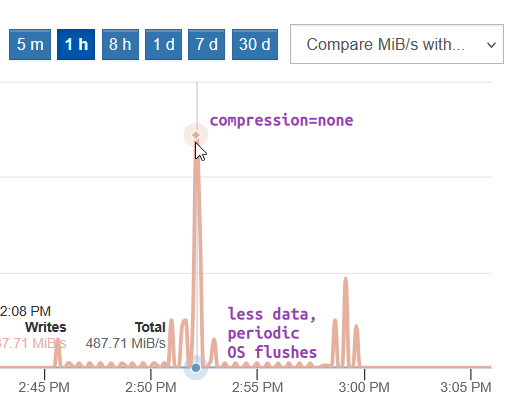
Where there's no compression, writes are constant enough to cause constant IO flushing, but in tests with compression enabled, data written to disk become a fraction, so OS takes longer to flush and does it in small chunks.
One producer sending 1KiB messages to one broker shows steady flow on producer side, but as we can see from the above image, while Kafka service traffic seems steady, that's not at all how disk IO behaves. Latency seen here is Kafka service latency, not I/O latency.
${KAFKA_BIN}/kafka-producer-perf-test.sh \
  --topic perf-test \
  --num-records 30000000 \
  --record-size 1024 \
  --throughput -1 \
  --print-metrics \
  --warmup-records 1000000 \
  --producer-props \
    bootstrap.servers=localhost:9092 \
    acks=all \
    batch.size=16384 \
    linger.ms=5 \
    compression.type=lz4
Maximum service latency is well below 1ms, which is expected for NVMe arrays with a light workload.
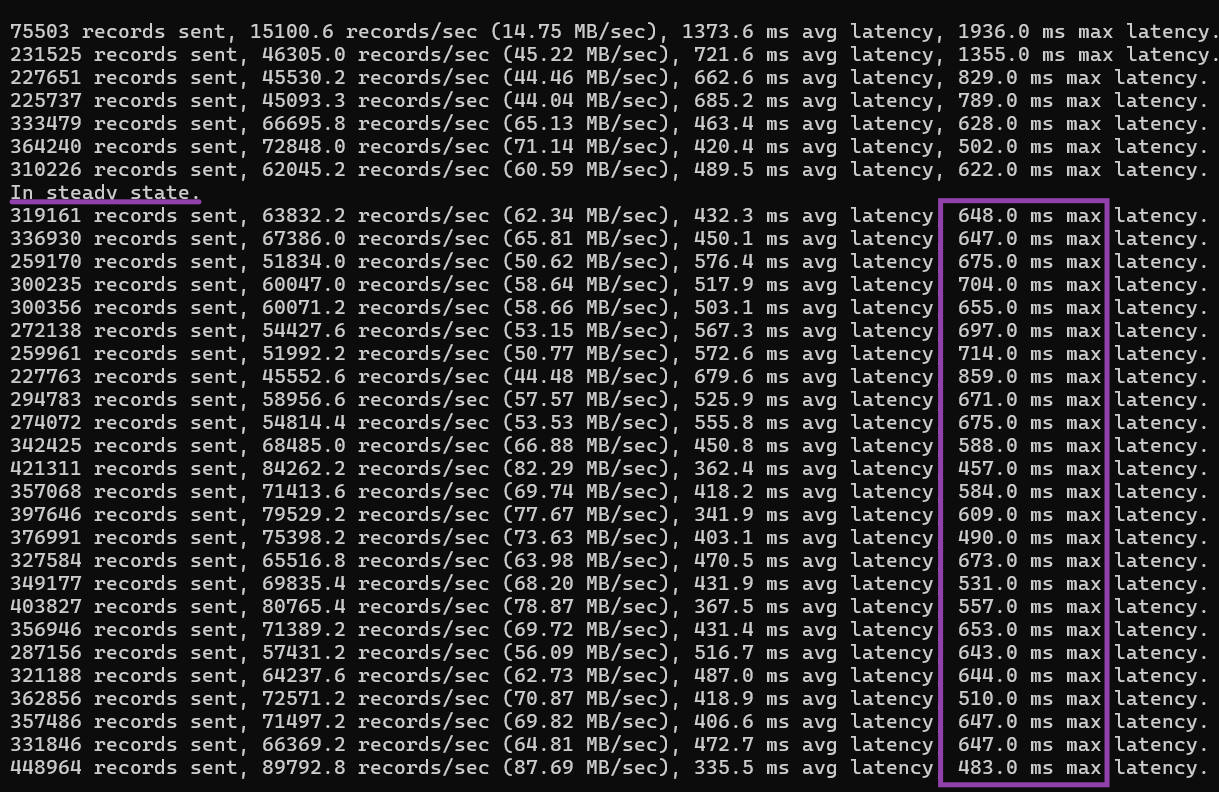
We could get more action by using larger messages, for example, but I used larger (~8KiB) messages in compression tests, so I wanted to examine smaller message sizes as well rather than chase higher I/O numbers.
One consumer fetching messages from one broke: this is a much easier workload (100% mostly sequential read) and the effect of OS cache was clear as not much I/O was seen in array's performance monitor. I would need a lot more data to remove the effect of cache and wasn't going to spend more hours on this than is required to get basic insights.
$ ${KAFKA_BIN}/kafka-consumer-perf-test.sh \
  --bootstrap-server localhost:9092 \
  --topic perf-test \
  --num-records 5000000 \
  --fetch-size 1048576 \
  --command-config consumer.properties \
  --show-detailed-stats \
  --reporting-interval 1000
consumer.properties:
fetch.min.bytes=65536
fetch.max.wait.ms=500
max.partition.fetch.bytes=1048576
fetch.max.bytes=52428800
max.poll.records=500
receive.buffer.bytes=1048576
max.poll.interval.ms=300000
We can see read I/O is steady and close 0.5 GB/s.
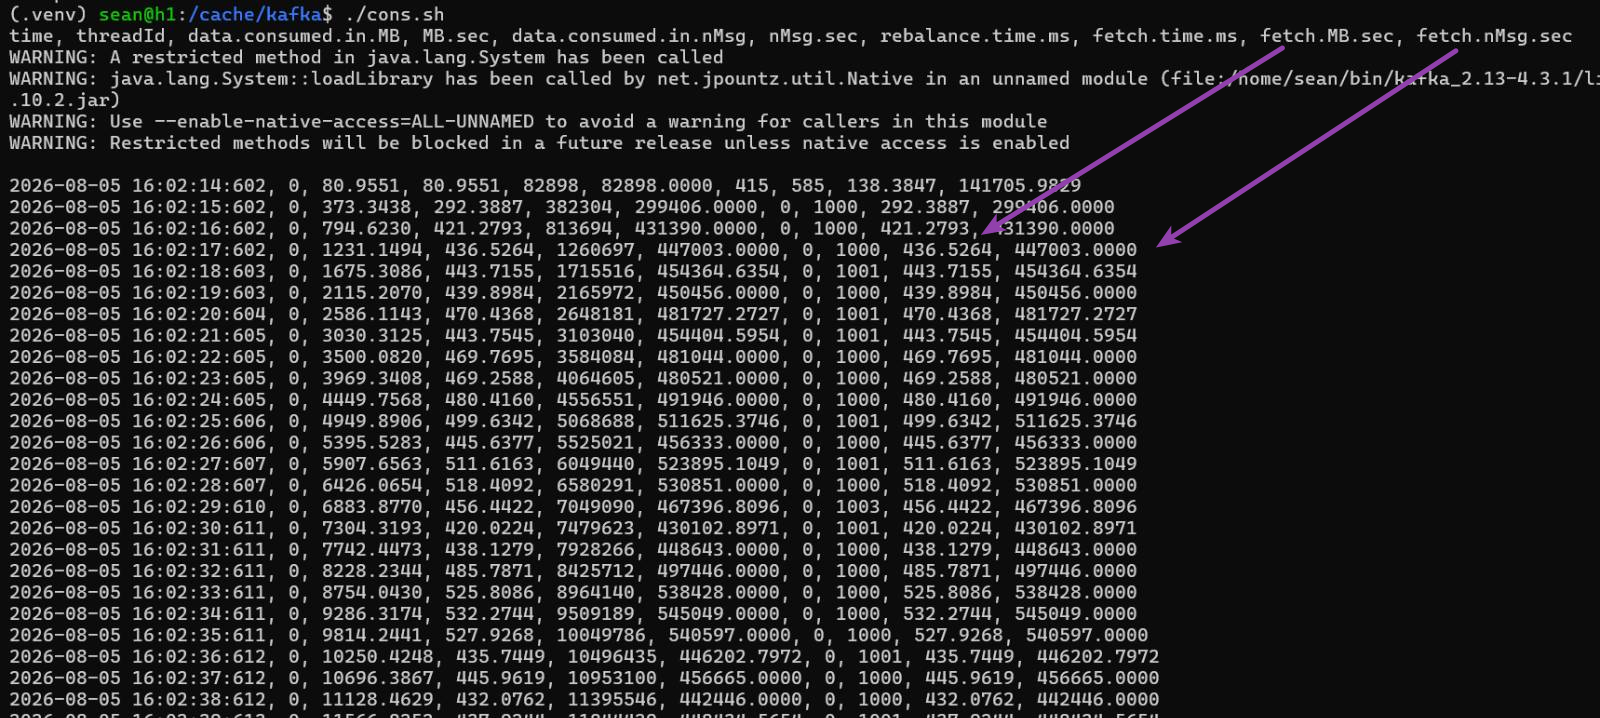
It doesn't take long to realize we can't conclude much about storage with this configuration. Not only is storage barely used, but even in this case there are several key options which can be tuned to skew the results in any direction we want.
Knowing that producer's I/O request size was close to 1 MB, we could size based on this I/O pattern, but it would apply only to this particular topic. The same applies to for consumers, although controller and OS cache would offload some I/O from storage, so we should account for that to avoid over-sizing.
We'd need a bunch of clients and topics and a lot more testing to be able to make precise estimates.