NATS server with NetApp E-Series
Introduction
Yesterday's post about Lakekeeper mentioned event store as one of key interfaces. NATS and Kafka were mentioned as supported options.
I blogged about storage layout, capacity and performance sizing for Kafka from an E-Series perspective. This post will be similar, but about NATS and with less focus on storage efficiency.
NATS is less of a resource hog and nicer to work with. I used it in S3 GO NATS and have two other projects where I'll use it. Because it's much easier to use, it may look like it doesn't require much thought, but that's only for lightweight use cases.
NATS Core vs NATS JetStream
NATS Core doesn't persist messages to disk. It requires you to have an active subscription to a subject (or "topic") to receive messages. To be there is the only chance to pick 'em up. In this Publish-Subscribe approach, usually there's one publisher and more than one subscriber for each subject.
NATS JetStream is a persistence engine built into NATS. Messages received can be stored in memory or on a (filesystem-formatted) disk and replayed as needed.
As you can imagine, JetStream is the kind that interests us, because it's persists streams to storage.
Lakekeeper, as one of the many clients that would need a messaging system, mentions its service interface as "event store". What's published is change events, but cloud events can also be published. These are likely less than 1 KiB each and use JetStream (although I might be wrong - I haven't tried these yet).
What's more important, though, is you won't build a messaging system just to deliver Lakekeeper or any other individual system's messages. You'll likely build a system for more than one service. Some services will use a Pub/Sub pattern, others Push/Pull, etc.
E-Series for NATS
You want more than one type of messages, both with and without persistence.
What that means is many services will depend on this messaging service. What you want from storage is:
- Performance - if it doesn't work fast enough, it doesn't matter if it's got six 9s
- Availability - this explains why some people use physically separate storage and replicate data 3x (even at the cost of additional capacity and much lower performance)
What we won't do with storage is:
- Care about storage efficiencies
- Take snapshots
- Replicate persistence data (DR)
- Backup or restore
- Perform Business Continuity-type failover for storage consumed by messaging services
- …
You get the idea.
Performance
NATS in Pub/Sub mode doesn't require much from storage. It's more or less trivial for flash storage to handle it.
NATS JetStream uses "streams" to store messages. It can use memory (non-persistent) or files (with RF going up to 5 and 3 being the best value for money, according to the NATS documentation). Within streams, there are two abstractions, one is KV Store and the other is Object Store. Again, KV is simpler from a storage perspective, while Object Store is for file objects which tend to be bulkier and take up more space.
Here we can see a JetStream KV test result:
14:26:04 Starting JetStream KV putter benchmark [bucket=benchbucket, clients=1, msg-size=128 B, msgs=100,000, purge=false, sleep=0s]
14:26:04 [1] Starting JetStream KV putter, publishing 100,000 messages
Putting       3s [================================================================] 100%

NATS JetStream KV putter stats: 30,067 msgs/sec ~ 3.7 MiB/sec ~ 33.26us
3.7 MiB/s, folks! It'd take me 3,000 servers to stress my disk array! But I have just one server that runs three NATS server and all subscriber-clients.
To exercise storage to at least minimum levels, we therefore:
- Can't use NATS Core
- Can't use NATS JetStream KV Cache
- Should use not just tiny messages, although in real life most may be just 100-1000 bytes (not all will be)
That leaves us with JetStream ObjectStore and even there we have to be careful: using 1KiB objects won't get us anywhere either.
| Setup | RAID Level | Replicas | Object Size (KiB) per run | Sync setting per run |
|---|---|---|---|---|
| Single server | 0 | 1 | 1,4,8,16,32,64,1024 | 3 runs with immediate and 3 with delayed writes |
| Three servers | 0 | 3 | 1,4,8,16,32,64,1024 | 3 runs with immediate and 3 with delayed writes |
| Three servers | 1 | 3 | 1,4,8,16,32,64,1024 | 3 runs with immediate and 3 with delayed writes |
Using a single server doesn't do jack. But we need it for a baseline.
Using three servers on two different RAID levels (RAID 0 and RAID 1, each with same number of physical disks on EF600) gives us some idea about difference in performance from RAID level.
With just three servers, we may run out of resources before we stress out storage array. So we go from 1-64 KiB and then jump 1024 KiB messages (objects) to skip to something that should move the stress-o-meter needle. UPDATE: it turned out we didn't run out of anything because tests didn't increase the number of data-generating workers, which then bottlenecked the consumers as well. Another batch of tests (see Appendix B) were executed with multiple nodes, multiple workers and load balancing of everything.
Availability
NATS' quorum is RAFT-based. Similar to other services based on RAFT, data consistency requires at least half the nodes plus one.
They recommend 3 or 5 replicas. Single copy/replica is possible, but has no redundancy and resilience. To get RF3 for MYSUBJECT, run nats stream add MYSUBJECT --replicas 3.
What happens if you lose a server or a server loses a RAID 0-based disk? If you have five replicas, you can even lose two. But if you have three, then just one may be lost.
NATS can create replacement stream replica automatically if:
- Impacted stream is of replica configuration R3 (or greater)
- Remaining intact nodes (stream replicas) meet minimum RAFT quorum: floor(R/2) + 1
- Available node(s) in the stream's cluster for new replica(s)
- Impacted node(s) removed from the stream's domain RAFT Meta group (e.g.
nats server cluster peer-remove MYSUBJECT)
This peer-remove example shows how to remove a NATS server from replica list for that particular subject. There's also manual recovery (when automatic isn't available or malfunctions, which isn't how it should be on day 1) and backup and restore, which is of limited value for service availability. We want to aim for automatic recovery, so at least three nodes with three replicas.
Note that NATS doesn't recommend two replicas, although it technically works. Also four. In their documentation (I can't find the link now) they don't see much benefit from the extra copy, i.e. four is not much better than three, but uses 33% more resources. With VMs (or containers) and E-Series, it can be worth the trouble, both RF2 and RF4, but I'm not going to complicate this post with that - I'll just stick with their RF3 and RF5.
NATS, storage arrays, racks
Incredibly, when the topic of service and data availability comes up with IT people, some claim they must run three replica of this or that service for HA reasons, but it's all in the same rack - two L2 switches, three servers with NATS or Kafka VMs, and there's just one storage array. Their entire IT depends on services running in that one rack. (And probably there are other such racks…)
The second recurring situation is when using three entry level arrays is suggested as an alternative to using one mid-range in one rack, most can't accept it because of HA or performance, although that's usually wrong on both counts.
It's obvious that it doesn't matter how great your array is if your rack loses power or L3 network connectivity. Get three cheaper arrays and do it right.

Clustering NATS (or similar services) on top a storage cluster that spans racks and can tolerate loss of a rack (SolidFire is one such storage product) is less bad, but still not good.
I prefer the approach depicted above, where each rack has own redundant array - just one step above servers with internal storage using RF3. If you need more than one type of RAID or simply don't have the time to pay attention to servers, take disks out to a simple array in the rack.
RAID 1 (10) or RAID 0
- Vertical rectangles are physical disks
- Horizontal are "volumes" (LUNs) created on top of a RAID (only R10 and R0 are shown) or DDP (not shown)
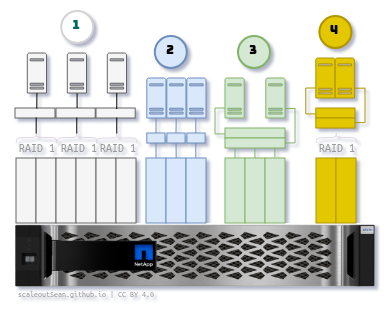
- (1) shows six disks in three RAID 1 disk groups (or "volume groups" as E-Series calls it). You can create a single LUN on each group and present each to a single NATS server. Then you configure RF3 in NATS. You could use more than just two disks in a RAID 1 disk group, of course. That's what should be done if you have just one array for multiple NATS servers
- (2) is like (1), just without redundancy. It looks weak, but if you have three arrays and five NATS server per three arrays, it's usable
- (3) is risky as it creates volumes striped across unprotected disks. Now if a single of those three green disks fails, all NATS go down and lose data. Not a good idea unless you're building some ephemeral KV cache for AI, for example
- (4) is like (1), but with LUNs that are less than full usable capacity of underlying RAID.
Pattern (1) is recommended for all deployments (one or more arrays). If you can't max out the disks, use pattern (4) and put more services on the three RAID groups.
Pattern (2) is something I wouldn't recommend for NATS, but for the sake of an argument, I think it's still usable for 3-rack deployments with 3 or 5 NATS replicas. Let's see:
| Rack | Servers | R0 Disks | "Spares" | Disks per Rack |
|---|---|---|---|---|
| A | alpha, bravo | 1 + 1 | 1 | 3 |
| B | charlie, delta | 1 + 1 | 1 | 3 |
| C | echo | 1 | 1 | 2 |
| TOTAL | 5 | 5 | 3 | 8 |
Keep a hot spare in each array so that you can quickly deploy a new R0 "group" and volume for NATS. It takes 30 seconds.
If you have 5 NATS servers, you can lose two servers (or two disks), the same as in a RAID 6 group. But, if you take 8 disks you can't even create a good RAID 6! And if you do, it will all be in a single rack. You are one rack failure away from downtime of all your services enterprise-wide.
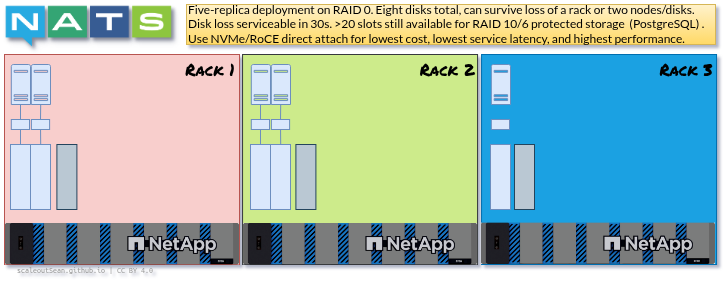
So, is a single array with a large RAID 6 in mid-range EF-Series better than five NATS servers each using own disk for RAID 0 on entry-level EF-Series? It's not.
If you can't stomach RAID 0, the same benefit exist with three racks with RAID 1; in fact you'd need just one additional disk (scenario (4) above) in the 3rd rack to create three RAID 1 groups instead. But even when RAID 1 is mentioned, I get the same exact comment ("Bbbbut, double disk failures"), so I may as well just talk about RAID 0.
File that one under "nobody got fired for using RAID 6"….
Why not RAID 1 on DDP storage pools?
DDP supports RAID 1 volumes, so yes, there's nothing wrong with that, especially if you want to keep it simple and need RAID 6 volumes as well.
My assumption in this post was:
- "Data" (as in data lake tables) may be predominantly read and prefer RAID 6. Maybe even NL-SAS. Messaging is semi-ephemeral (persistent, but not for long, and also replicated, so individual volumes may be lost), and very small I/O requests
- With such a distinct mix of very different workloads, it's not a bad idea to separate workloads if we get to a scale where you have enough disks to create multiple groups. With PostgreSQL as a separate requirements for Catalog (in the Lakekeeper example), we have enough workloads to justify mid-sized RAID 1 disk groups (example: 3 RAID 10 of 8 disks per group), so we'd run out of disks in the controller shelf anyway and probably need multiple arrays where we could justify RAID 1 disk groups
We could use DDP for everything (PostgreSQL, data lake tables, messaging), but when data gets to certain scale such as multiple racks, we can afford to use more specialized storage layouts.
Conclusion
It's not easy - especially not without workload details - easy to estimate storage performance requirements of NATS service. In the stacks like Lakekeeper, they're likely to be light (events, notifications) if your data lake has just such light messaging workloads. That's never the case, and it gets worse quickly if S3 is involved because - see a real-life IoT example - you may need to offload S3 to NATS and use NATS for larger objects.
Secondly, as Lakekeeper also needs fast and highly available Postgres service, the exact same pattern (one array with multiple R1 groups, or three entry level arrays with PostgreSQL replication) is used by Cloud Native Postgres, so you already have the same requirement for PostgreSQL and EF-Series is more than capable of handling both at once.
As you can see in Appendix B, I got merely hundreds of Objects per Second in NATS JetStream tests, which shows once you start moving data, and not just messages, through such services, performance can become a scarce commodity very quickly. Especially so if you want maximum resilience and chose immediate sync-to-disk for important subjects (see the difference in Appendix B).
Delayed writes are helpful for performance, but losing delayed writes from two (or all) nodes isn't going to be a great experience not just for NATS admin, but for all services that depend on reliable and low-latency messaging.
But that's what people set themselves up for when they enable delayed writes and all NATS volumes live on a single disk array (naturally, in a single rack).
Do it right:
- Single rack, single array (three RAID 10 groups in the array)
- Three racks, three arrays (one RAID 10 group per array)
- Use small capacity disks if you don't need a lot of capacity. Leave 15% empty for disk wear leveling
You need this approach even for NATS Core type of event services because that has nothing to do with storage. If all your servers are in the same rack that can get disconnected from L3, all your NATS servers are good for nothing. If you do spread NATS servers (containers, VMs) around multiple racks but your storage array isjust one, then you start having a storage problem, because now all servers can still go down if they lose access to the rack where the storage array is.
Appendix A: Highlights from NATS test runs
Volume segment size setting is available in classic disk group configuration wizard (DDP storage pools don't let you set this, it's set automatically). 32 KiB is the smallest segment size and it's suitable for small I/O requests.
I created three volumes on each (R1 and R0 disk group) using the pattern described in (3) and (4) above. Each RAID disk group had 2 disks (way too much performance for the NATS workload we could generate).
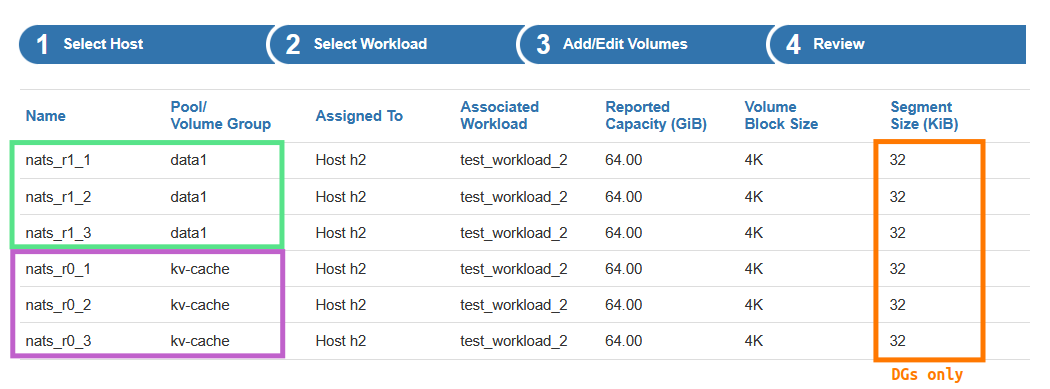
Tests were executed as described in the performance section above:
- single NATS server on R0 as baseline
- three NATS servers on R0
- three NATS servers on R1
- three runs for each object size (1, 4, 8, 16, 32, 64, 1024 KiB) and each of these was executed in immediate and postponed sync to disk, so 3 x 7 x 2 tests
Note that these highlights are from the single data generator tests without parallelization of workers and consumers; only servers were scaled from 1 (RAID 0) to 3 (R1 and R0), so we didn't get good results from scaling just NATS nodes. In Appendix B we describe the second batch of tests with more parallelism, which produced significant improvements.
Periodic sync flushes pending JetStream objects every so 10-20 seconds. That's why there isn't much going on (maybe some RAFT state dumps, service logs, and such) most of the time. You can see that, every 20 seconds, the piled up uncommitted writes are flushed to disk at once.
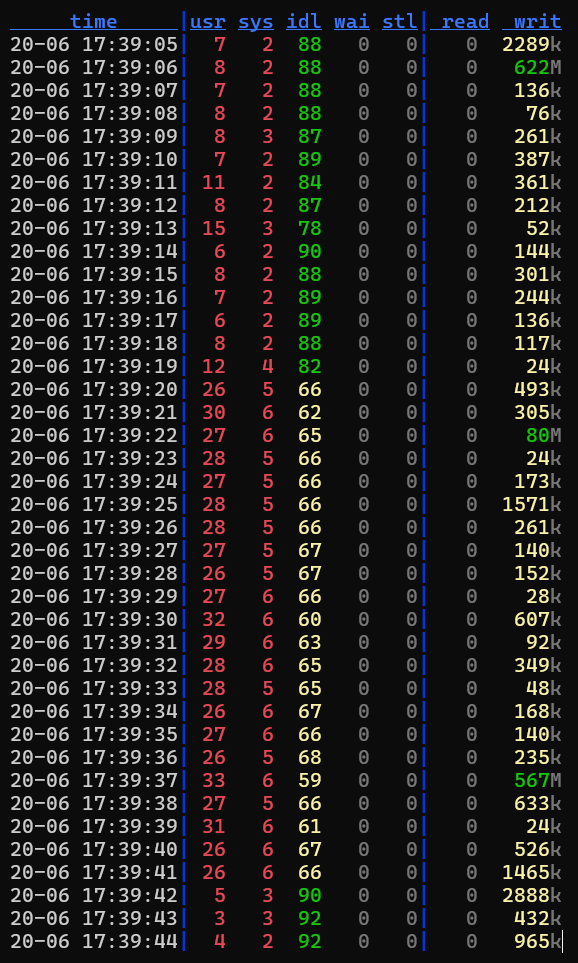
SANtricity Web UI averages and hides these short-lived spikes which is correct for day-to-day operations, but it doesn't work well for short-interval performance monitoring. I can't see any trace of that 570 MiB write spike; instead, I see 15-20 MiB/s-ish over 30 seconds… Not usable for performance monitoring unless you have a steady workload that goes on for many minutes.
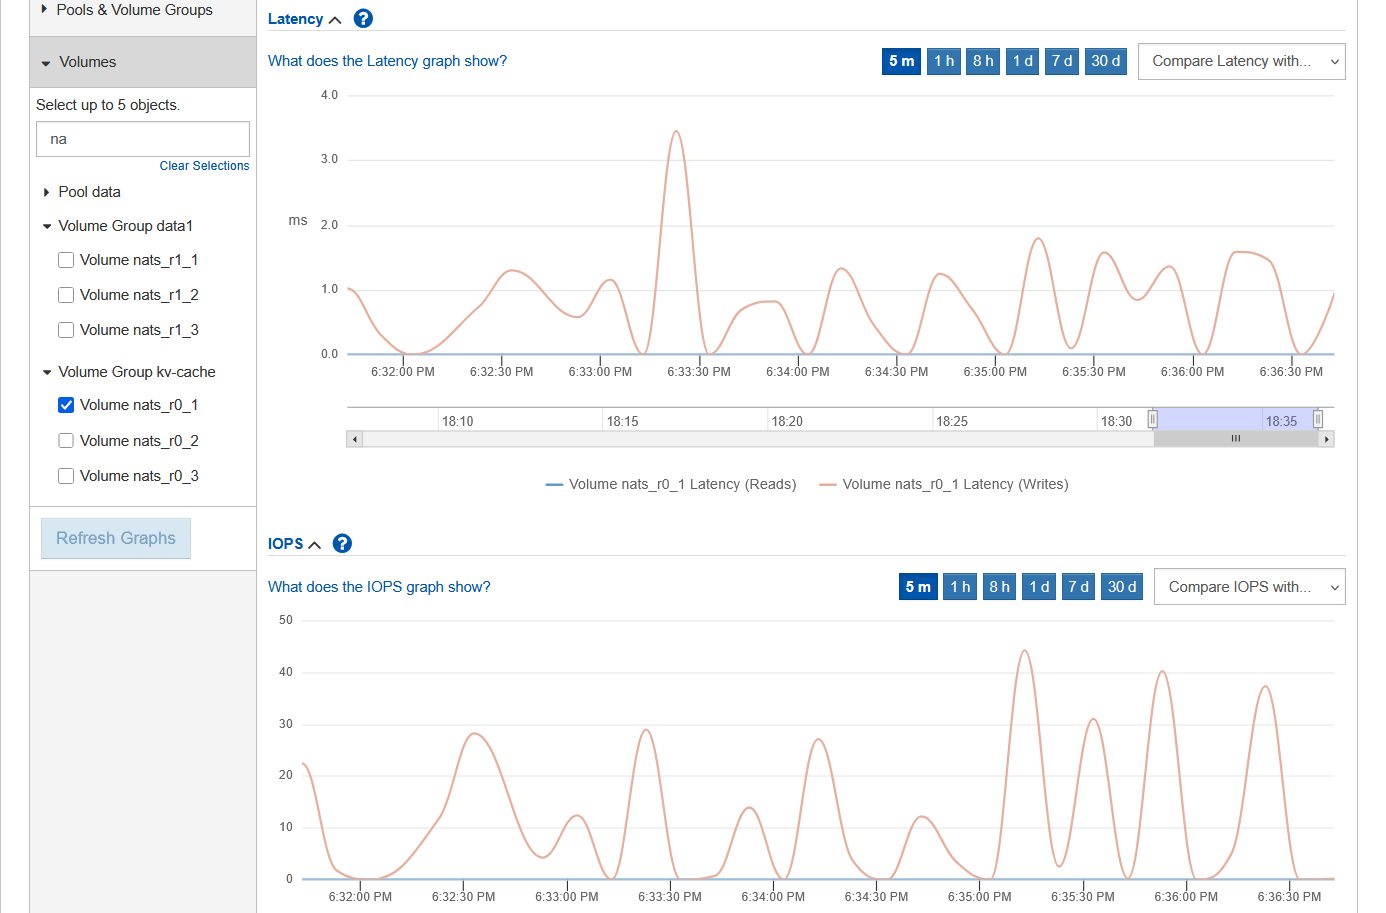
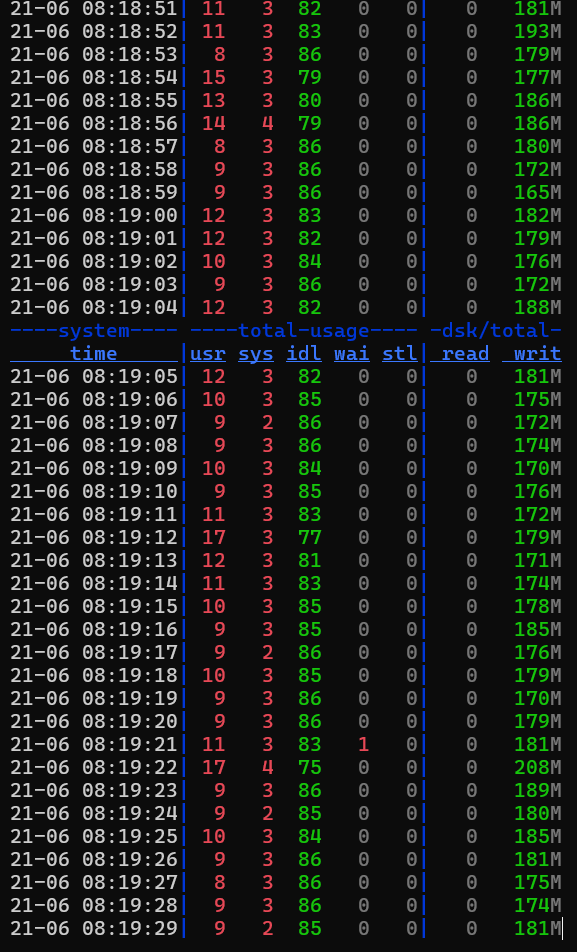
dstat shows clearly when we switch to immediate sync. Objects get written to storage immediately. The result is sustained smaller write requests.
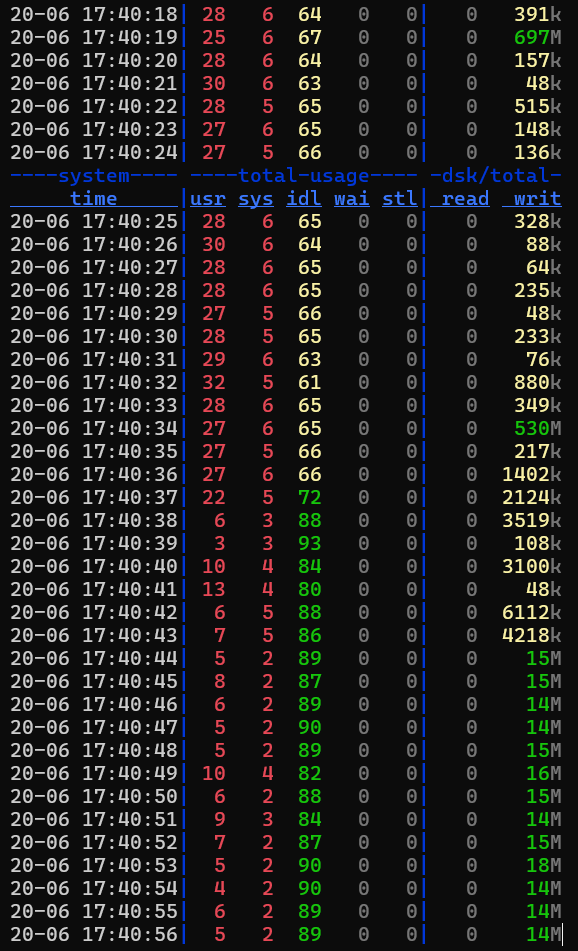
One possibly deceptive outcome of this in the SANtricity UI is latency becomes much "better". But that's not really a benefit. We're now getting tiny writes, instead of 500 MB blasts (which take a few milliseconds to process, fair enough), but this hardly matters to NATS because servers serve latest objects as soon as they get them. In fact, this "immediate sync" is worse for NATS performance, because no send can get acknowledged until it's been written to disk.
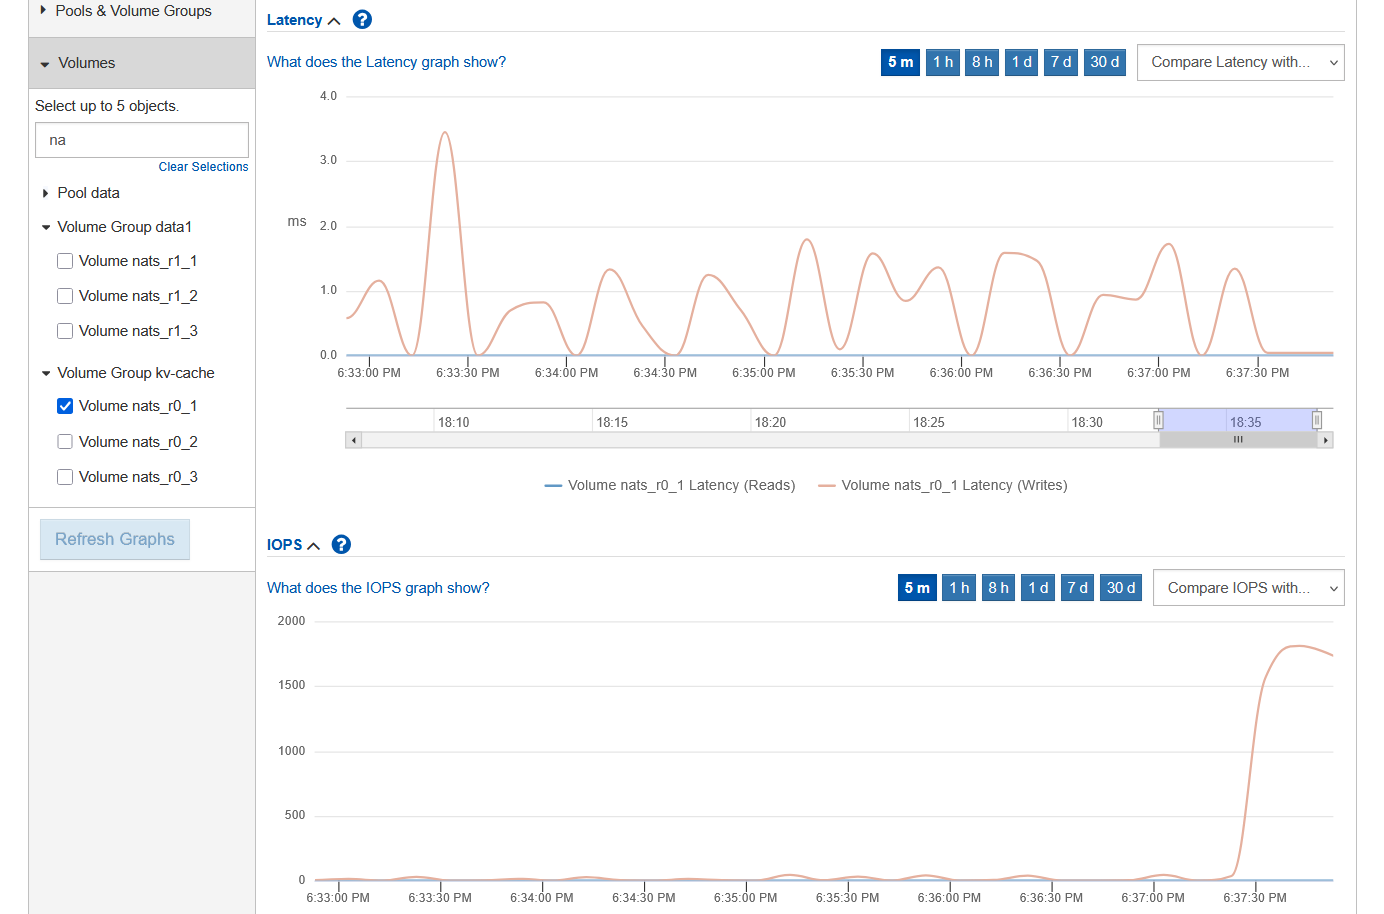
On the other hand, IOPS shoot up dramatically, because rather than dumping 500 MiB or 2,000 MB to disk at once, now NATS servers have to write objects to storage as they come. If they're 4 KiB large, then writes are in tiny 4 KiB requests. See in Appendix B, the difference between immediate and delayed writes has a big impact on performance.
As far as disk array is concerned, latency looks great because IOPS are very low. But this is what happens with small messages (few KiB) - it just can't go faster.
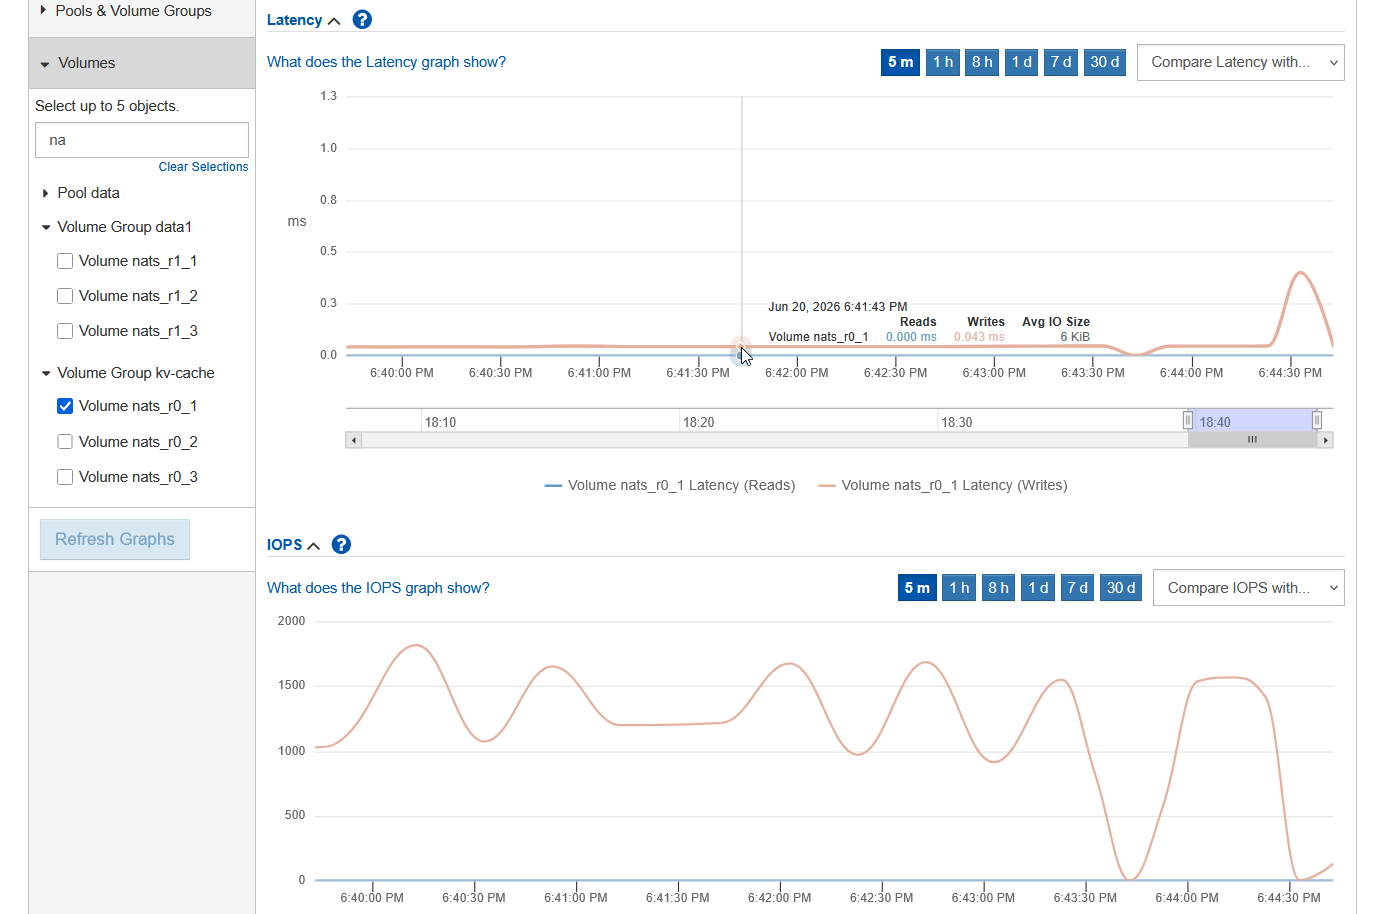
Let's take a look at the impact of object size. This is on single node NATS cluster with immediate sync using 1 MiB object size.
The same thing with periodic sync shows that:
- Bursts happen more frequently because object sizes are lot larger (1,024 vs 1-64 KiB earlier)
- These bursts are now large enough to impact other workloads
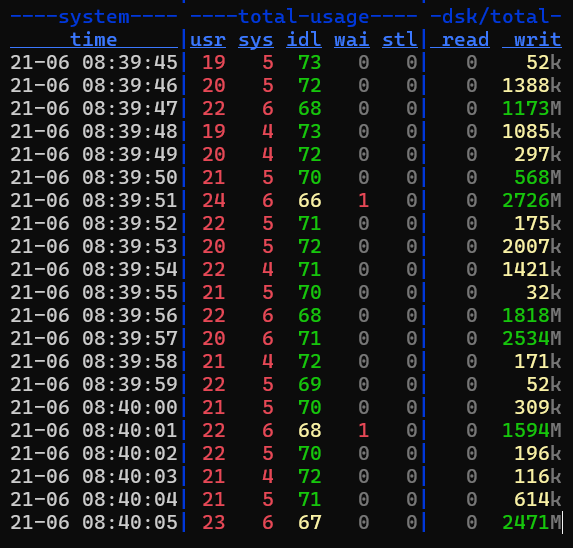
Not everyone will have such object sizes, but they can be even larger (the NATS documentation refers to 8 MiB objects as reasonable) and with more NATS servers in a cluster or more clusters per disk array, 5-10 GiB bursts become possible.
That still wouldn't matter for EF-Series, but if you have other services on the system, e.g. consumers/subscribers who also consume gigabytes every second and write to own stores, it may be wise to start paying attention to the impact of these bursts.
As a reminder, even in 3-node NATS server tests, that's just 3 LUNs (one per server), so 1 GiB/s per volume.
If you replicate 3x, disk output grows. What was 170 MiB with a single server (1 MiB objects, immediate sync) now results in 450 MiB/s.
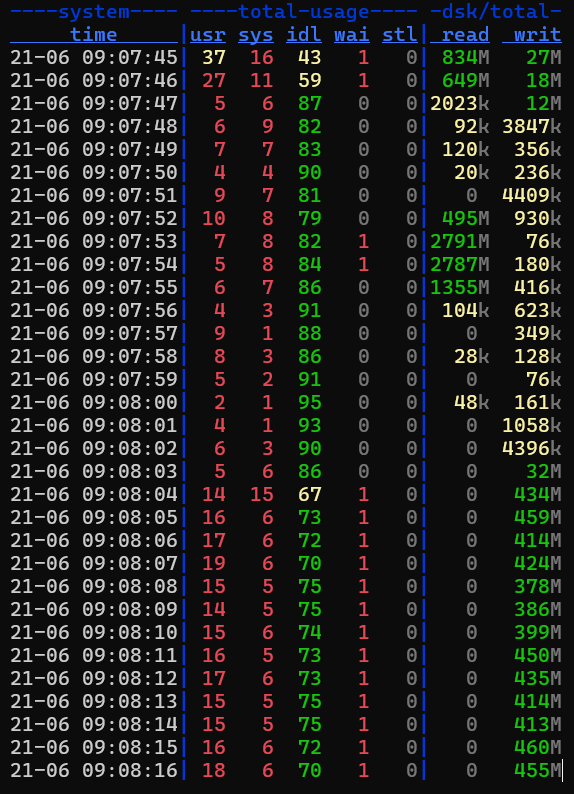
At 09:07:52 there's a read spike. That's not a sudden flood of GET requests from clients, but NATS cluster restarting between tests and when NATS restarts with data in place, it re-reads everything as its way to confirm consistency - a RAFT/NATS version of fsck, if you will. While that's not a workload as such, it shows that each is consuming around 1 GiB/s during that time and how long that lasts depends on how much data is in the storage.
At the top of this last screenshot you can see that writes at the top of the screenshot were 10-30 MiB/s which is likely the end of last run with 64 KiB object sizes. Read on service startup can therefore be much longer and may also impact both service availability (if they take 10, 20 seconds) and other workloads (if a bunch of servers reads at 5-10 GiB/s for 30 seconds). That's why having sequential performance in excess of 10 GB/s is helpful. NATS cluster restarts may be infrequent, but when they do happen (failover, etc), you don't want all workloads to feel that.
Appendix B: Summary results
These are for the first batch of tests.
- NATS 2.12.11
- Ubuntu 24.04 LTS server
- EF600 (NVMe)
- NATS test parameters
- Object generator: one
- Objects per run: 4,000 for PUT, plus more GET
- Consumers: 20 (all on the first NATS server node (no load balancing))
- Objects per consumer: 200
- Object sizes per individual run: 4, 8, 16, 32, 64, 1024 KiB
- Replicas: 1 (single node), 3 (3 nodes)
- RAID: 0, 1
The biggest (performance) benefit came from delayed writes to disk.
RAID 0 performed well compared to RAID 10, which I did not expect to see in the results considering that I/O was low and nowhere near saturating physical SSD disks.
8 KiB object size with Single, 3 servers on R0, and 3 servers on R1 (separate runs with immediate and delayed sync to disk):
| Scenario | Sync | Obj/Size KiB | Avg Put Obj/s | Avg Get Obj/s |
|---|---|---|---|---|
| r0-single | immediate | 8 | 337.79 | 135.11 |
| r0-single | delayed | 8 | 479.31 | 191.72 |
| r0-rf3 | immediate | 8 | 196.17 | 70.89 |
| r0-rf3 | delayed | 8 | 304.43 | 121.27 |
| r1-rf3 | immediate | 8 | 150.57 | 60.23 |
| r1-rf3 | delayed | 8 | 288.60 | 115.44 |
1,024 KiB object size:
| Scenario | Sync | Obj/Size KiB | Avg Put Obj/s | Avg Get Obj/s |
|---|---|---|---|---|
| r0-single | immediate | 1024 | 64.28 | 25.71 |
| r0-single | immediate | 1024 | 73.49 | 29.39 |
| r0-rf3 | immediate | 1024 | 56.22 | 22.49 |
| r0-rf3 | delayed | 1024 | 71.94 | 28.78 |
| r1-rf3 | immediate | 1024 | 42.62 | 17.05 |
| r1-rf3 | delayed | 1024 | 71.91 | 28.76 |
I should look at low-level IO metrics differences between RAID 10 and RAID 0 disks host-side to see if that's obvious in I/O latency levels as well. RAID 0 volumes aren't supposed to be that much faster - it's literally just 2-3 hundred MiB/s or several thousand IOPS…
The second batch of tests were changed to get parallelism from data-generating workers and clients:
- Allow N workers (and used 3 workers in scenarios below, compared to 1 worker earlier)
- Note that this benefitted single NATS server test, because it got 3x the workload, while all clients were always already "load balanced" to it
- Spread N workers among M server nodes if possible (i.e. when M>1)
- Three data-generating workers on three servers means one worker per server; we should try 9 (3 per server) to keep the number of data generating nodes consistent with the single server scenario
- Spread K consumers (default: 20) across M NATS nodes (when M>1)
- Had we kept the number of workers per server consistent, we would also have increased consumers by 3x for the three-server tests. Something for future work
That visibly improved both PUT and GET performance.
8 KiB tests with RF3 (3 servers) and balancing of workers and consumers across all servers (separate runs for immediate and delayed sync to disk):
| Scenario | Sync | Obj/Size KiB | Avg Put Obj/s | Avg Get Obj/s |
|---|---|---|---|---|
| r0-single | immediate | 8 | 593.41 | 237.36 |
| r0-single | delayed | 8 | 974.42 | 389.77 |
| r0-rf3 | immediate | 8 | 539.53 | 215.81 |
| r0-rf3 | delayed | 8 | 775.84 | 310.34 |
| r1-rf3 | immediate | 8 | 332.88 | 133.15 |
| r1-rf3 | delayed | 8 | 1036.38 | 414.55 |
1,024 KiB tests with RF3 (3 servers) and balancing of workers and consumers:
| Scenario | Sync | Obj/Size KiB | Avg Put Obj/s | Avg Get Obj/s |
|---|---|---|---|---|
| r0-single | immediate | 1024 | 99.46 | 39.79 |
| r0-single | immediate | 1024 | 155.68 | 62.27 |
| r0-rf3 | immediate | 1024 | 82.01 | 32.81 |
| r0-rf3 | delayed | 1024 | 161.76 | 64.70 |
| r1-rf3 | immediate | 1024 | 58.02 | 23.21 |
| r1-rf3 | delayed | 1024 | 165.09 | 66.04 |
I expected more Get Obj/s, but I was wrong. Maybe I didn't do this test right, but the absence of read I/O shows us those gets always come from NATS server cache, so I doubt that is related to storage.
RAID 0 still seems unreasonably fast compared to RAID 1, but I did not look into why because there are many other optimizations that should be looked at before that.
Another interesting change with multi-generator and load balancing is that writes happen all the time rather than every few seconds, simply because there's a lot more data coming in. It almost looks like immediate acknowledgement.
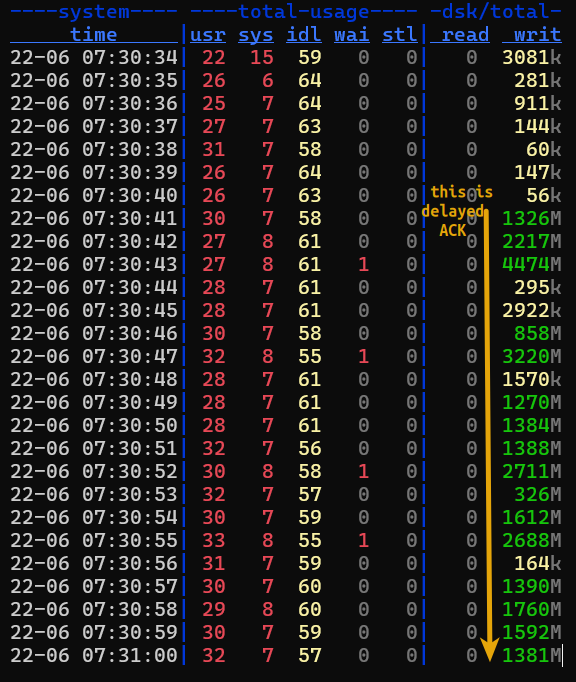
The main takeaway here is with improved parallelism we get better utilization of CPU and storage as we get close to 1 GB/s per volume.
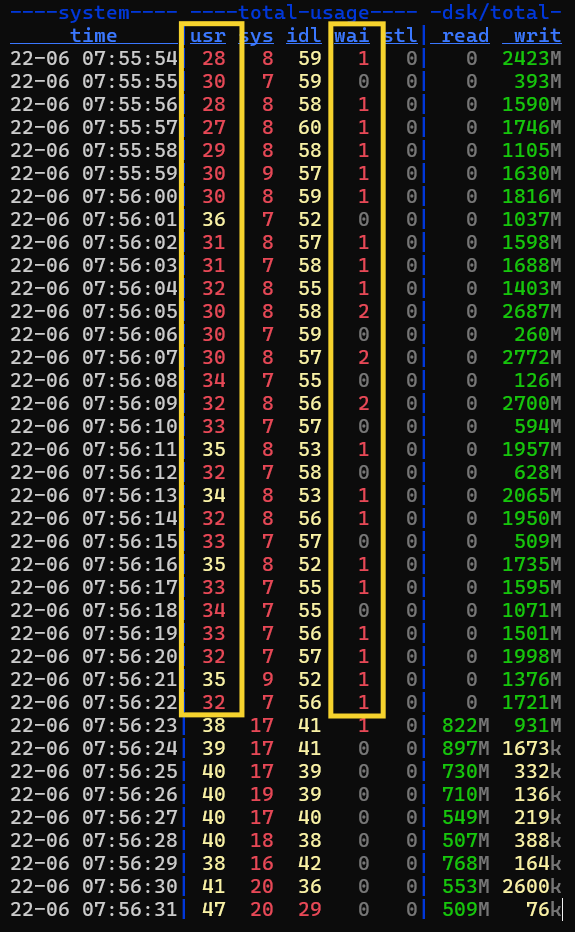
(The large read workload happens on NATS restart, as it checks existing objects for consistency; that's not part of results.)
I should have run JetStream baseline tests with memory-based storage to be able to compare RAID 0 against memory, but there's a lot of things that should be done better and there is no time or immediate need. Maybe I'll revisit that in the future.
Appendix C: Mystery of slow RAID 1
I couldn't resist, so I went to evaluate the first RAID 0 vs. first RAID 1 volume using fio, to see what's going on there.
Test:
- IOPS: 15,000
- Request size: 8 KiB
- R/W: 70/30
- Queue Depth: 8
They both ran at 15K just fine, but RAID 1 (right-hand side) ran at a higher latency compared to RAID 0 (left-hand side):
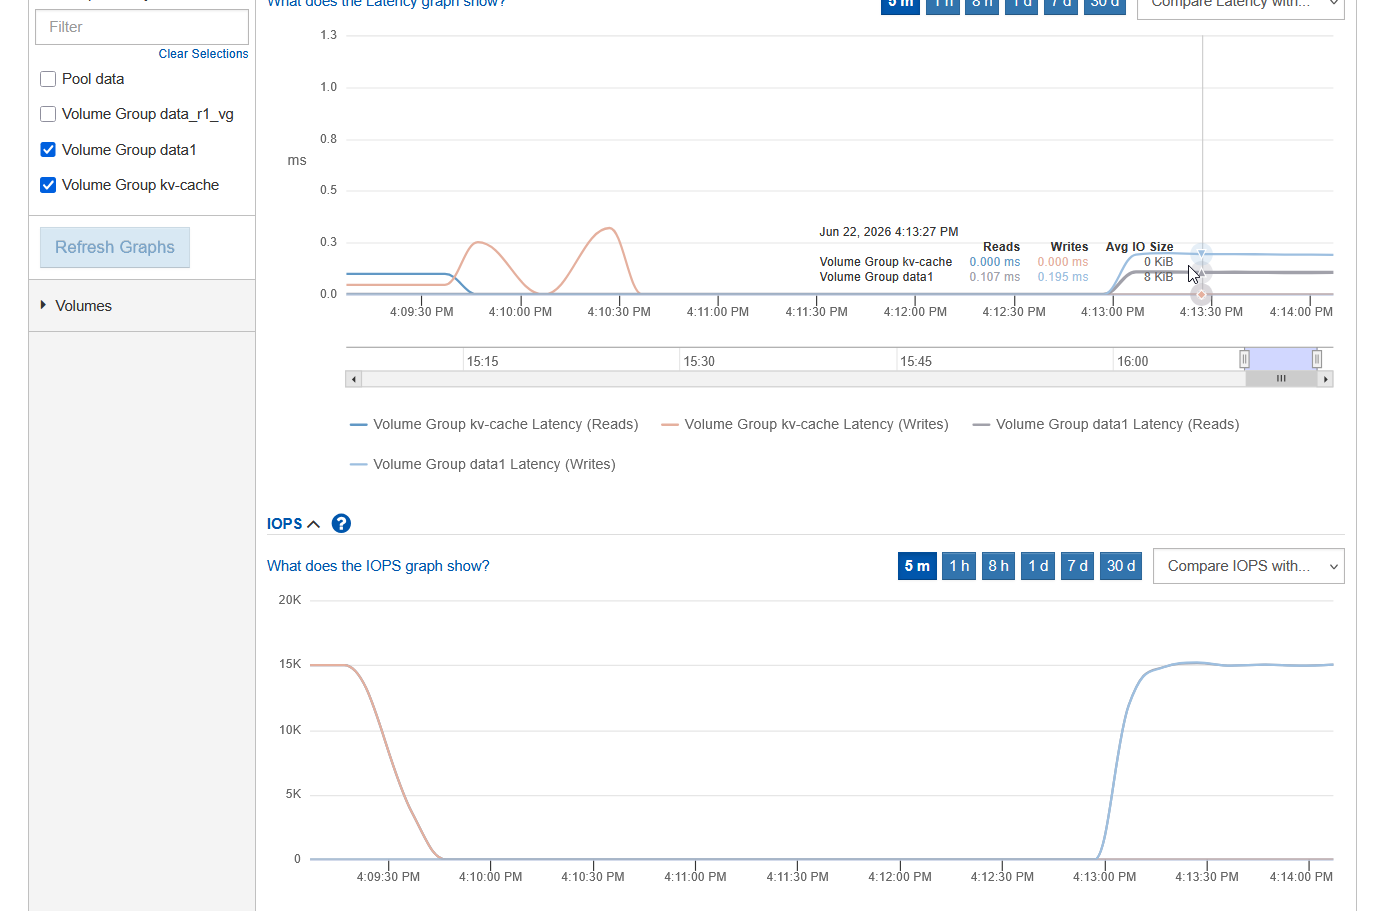
Summary and comparison of three runs on each LUN:
| Metric | RAID 0 avg | RAID 1 avg | Ratio |
|---|---|---|---|
| Read IOPS | 15,000 | 15,000 | 1.00x |
| Read lat p50 | 0.16 ms | 0.17 ms | 1.05x |
| Read lat p99 | 0.40 ms | 0.40 ms | 1.00x |
| Write IOPS | 15,000 | 15,000 | 1.00x |
| Write lat mean | 0.16 ms | 0.30 ms | 1.84x |
| Write lat p50 | 0.12 ms | 0.26 ms | 2.21x |
| Write lat p95 | 0.32 ms | 0.42 ms | 1.31x |
| Write lat p99 | 0.44 ms | 0.56 ms | 1.27x |
RAID 0 had a much lower write latency, which then compounded on NATS across RF3, especially in the runs with synchronous writes.
Then I remembered to check that old anti-caching setting and yes, it was on: write cache was forcibly disabled and all of the NATS volumes were all on that list.
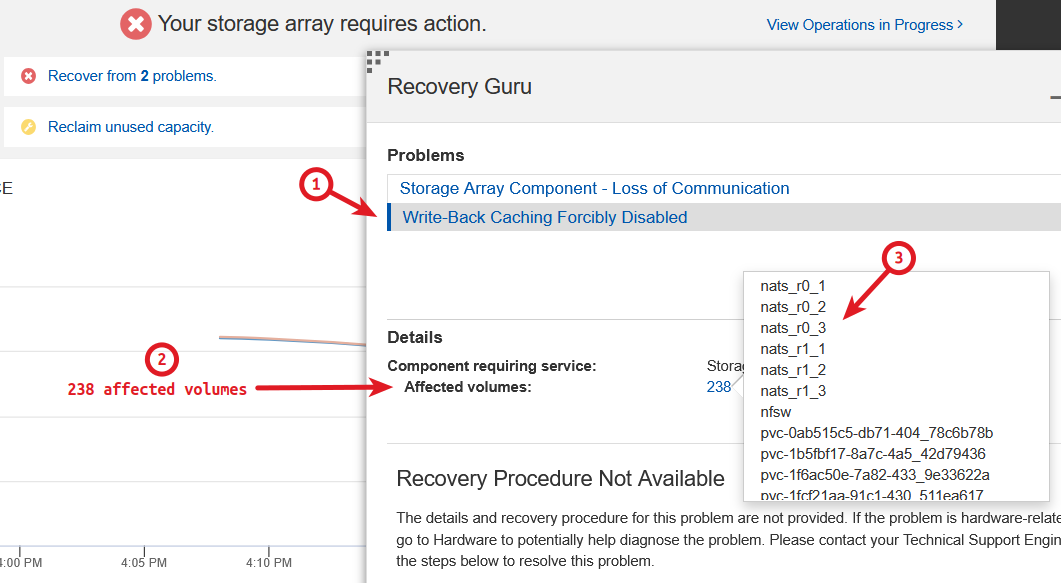
The reason that's disabled is to prevent getting fake good results due to write-caching in the controllers, which is the right way for this lab use (we don't want to benefit from write caching). I had known about this, but didn't think it I'd notice it in testing.
The only reason I noticed it was because I used RAID 0 which was not affected, so by comparison, this stood out. Otherwise, 0.2ms latency (observed on R1 with write cache disabled) wasn't attention-catching.
RAID 0 writes land on individual disk(s). Each RAID 1 write has to land on two and there's no write caching, which is what gets it. If write cache was enabled, writes would be mirrored to the other controller and instantly acknowledged. Seconds later, they'd be coalesced and flushed. We'd see similar latency for R0 and R1. But, because this basic optimization is disabled, writes to RAID 1 are much slower and writes to RAID 0 are not.
That's really a great find, because now we know RAID 0 works well even without array cache (as long as we don't exhaust disk limits), so the use case for five NATS servers makes more sense, and the KV cache use case (described in Above and Beeond) should work well.
UPDATE (2026/08/15): I noticed that NATS had a hard disk-concurrency limit that was fixed in July 2026 (v2.14.4). I don't know if it affected these tests.