Monitoring volume replication in NetApp SolidFire
- Introduction
- SolidFire volume replication
- Failed and not-so-successful approaches
- Good approaches
- What else?
- All together now!
- Conclusion
- Appendix A - replication metrics in SFC
Introduction
Few weeks ago I saw a question about resolving volume pairing problems and monitoring volume replication on SolidFire, which is why I restarted work on these things.
The first step was Project Longhorny, released a few days ago, which covers essential replication operations such as pair, list and even reverse (change of replication direction).
The second part of the question is about monitoring of replication. This post will be about that.
The third part - not part of this question, but it's a good question - is about making non-vSphere applications work with SolidFire failover. (For vSphere it was addressed with SolidFire's SRA.) I've started working on this as well. With Longhorny in place, I can do some more work in this area.
Back to the question of monitoring the speed of initial copying and volume pairing status after that is complete.
SolidFire volume replication
I suppose most SolidFire users know how SolidFire volume replication works, but if you're just browsing: we need at least two "paired" clusters, and two volumes with same properties.
The target must have its access mode changed to "replication target" while the source usually remains in "read-write" mode. Once they're paired, initial "baseline" happens asynchronously and then replication continues depending on the mode.

There are three modes:
- Async - as the word suggests, this mode allows up to hours of delay, but even on LAN networks some delay is usually present (there's no delay if the volume has no writes, of course). Async is the default mode for all new relationships. If we want one of the other two, we have to modify the relationship and pick one of the following modes
- Sync - there's no "delay" here, just added latency in writing. Data must be 100% in sync otherwise error is reported
- Snapshots-only - as the name says, only the special kind of snapshots - the kind that's enabled for replication - are replicated to the remote site. You may have 2 snapshot schedules on the source volume: one every 5 minutes that expires in 60 minutes, and one hourly that's enabled for replication and has the retention of 8 hours.
At the destination, the arrow is inbound indicating incoming replication for the same volume.

There's no fixed "destination" as such, though. Cluster and volume pairing is bi-directional and the "direction" of each individual volume relationship depends on which of them is the sole replicationTarget. The other(s) must not be replication target, but one of the non-replication target modes (most commonly read-write).
As you can see in these screenshots, if your clusters aren't too full or network out of order, once you correctly pair two volumes, they enter ResumingConnected. Note that I'm doing this on MTU 1500 on both Storage and Management network - it's not a problem at all.
The other day the question was why there's no progress indication, but replication status never even reached ResumingConnected. If they remain in PausedDisconnected or some other not-good status, then you need to RTFM, SolidFire KBs and maybe the NetApp TR-4741.
Let's take a look at monitoring approaches.
Failed and not-so-successful approaches
I did have two SolidFire clusters - needed them to develop Longhorny - but replication between them could not actually work.
The reason was their networks were asymmetric and only one routing (for Management Network) was in place, so pairing, configuration and un-configuration all worked great, but replication did not.
During that time I made some semi-educated guesses how we may be able to monitor initial volume copy and ongoing bandwidth.
Write workload at destination
I thought I had a pretty sound idea here: simply monitor writeBytes in SolidFire's volumeStats responses.
When the destination is in "replication target" mode, the only writes are from initial synchronization and replication.
Well, I just tried and … bzzzzt!
Write bytes from replication don't register in that counter.
But, let's not forget: by monitoring writeBytes on the source volume(s), we can get some idea of the amount of data that needs to be replicated. Maybe data is overwritten, in which case it won't add up, but after watching for a while you can know that for these volumes every 1 GB of writes results in 300 MB of network data transfer, for example. Knowing storage efficiency for the volume helps as well.
Node throughput
If there's nothing else, I thought, we can monitor the difference in network throughput during "usual" and "initial volume synchronization".
This is fine if you don't have bursty workloads or regular iSCSI client throughput that's 50x bigger than your replication bandwidth.
Then the effect of initial volume synchronization won't be even visible.
I was on an otherwise idle system so I was able to observe it, but it's not a generally useful approach.
Good approaches
Today I installed another SolidFire Demo VM and it plays nicely with one of the existing SolidFire Demo VMs, so I was able to take a closer look at what actually works.
Sync jobs at destination
Now this looks like a no-brainer, but it didn't when replication wasn't occurring.
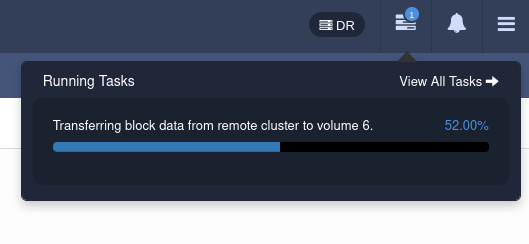
Another reason it's not a no-brainer is that if you play with little 1 GB volumes that have 100 MB on them, you won't even notice this thing. The UI refreshes every now and then and if the task takes 5 seconds (5s x 50MB/s), you may very well miss it.
I had to recreate a relationship five times until I realized there was a task thing going on.
Finally I created a larger and fuller volume to be able to spot the icon, click on Tasks and see it before it expires.
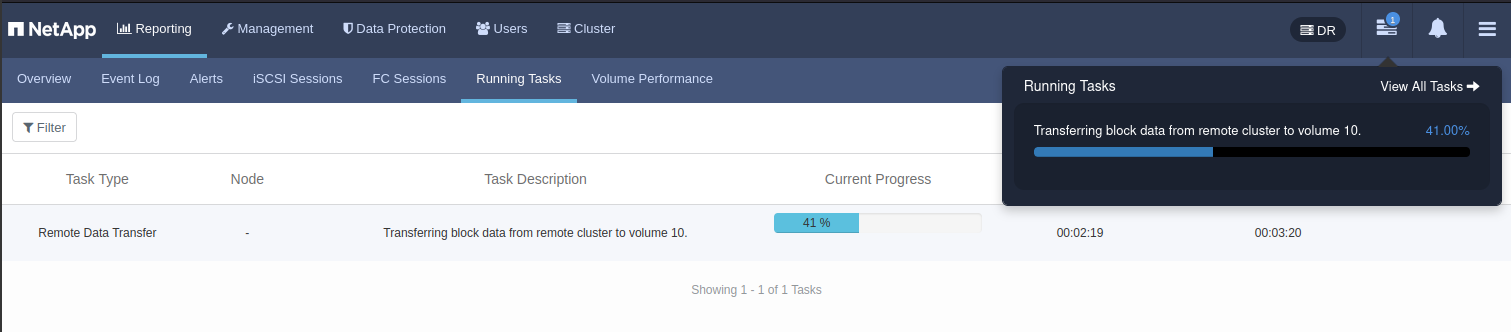
Then I had to switch to an even larger one to be able to take this screenshot.

With that, the rest was easy:
{
  "method": "ListSyncJobs",
    "params": {},
    "id": 1
}
Response:
{
  "id": 1,
  "result": {
    "syncJobs": [
      {
        "blocksPerSecond": 3338,
        "branchType": "volume",
        "dstServiceID": 5,
        "dstVolumeID": 10,
        "elapsedTime": 91,
        "percentComplete": 18,
        "remainingTime": 414.5555555555556,
        "sliceID": 10,
        "stage": "data",
        "type": "remote"
      }
    ]
  }
}
Some of the interesting ones:
- blocks per second = 3338 x 4kB = 10-15 MB/s
- destination volume ID = 10
- percent complete = 18 %
- remaining time = 414.55 seconds
Again, this is at the destination where volume ID 10 is a replication target. In PowerShell, the cmdlet is Get-SFSyncJob.
There's no such job/task at the source side for outgoing replication. Or at least I could not see it.
Volume's statistics at source
First, in that screenshot from the Web UI at the site where the volume is read-write, we see a column named Async Delay:
It's easy to see that may be useful now that replication works….
This is volumeStats object, asyncDelay is key where the value is stored.
{
  "id": 1,
  "result": {
    "volumeStats": [
      {
        "accountID": 13,
        "actualIOPS": 0,
        "asyncDelay": "00:00:00.000000",
        "averageIOPSize": 10736,
        "burstIOPSCredit": 90000,
        "clientQueueDepth": 0,
        "desiredMetadataHosts": null,
        "latencyUSec": 0,
        "metadataHosts": {
          "deadSecondaries": [],
          "liveSecondaries": [],
          "primary": 5
        },
        "nonZeroBlocks": 1309430,
        "normalizedIOPS": 0,
        "readBytes": 4908630016,
        "readBytesLastSample": 0,
        "readLatencyUSec": 0,
        "readLatencyUSecTotal": 295870928,
        "readOps": 59765,
        "readOpsLastSample": 0,
        "samplePeriodMSec": 500,
        "throttle": 0,
        "timestamp": "2024-06-14T08:50:46.726614Z",
        "unalignedReads": 0,
        "unalignedWrites": 0,
        "volumeAccessGroups": [
          4
        ],
        "volumeID": 135,
        "volumeSize": 20000538624,
        "volumeUtilization": 0,
        "writeBytes": 54330454016,
        "writeBytesLastSample": 0,
        "writeLatencyUSec": 0,
        "writeLatencyUSecTotal": 7939281008,
        "writeOps": 8191186,
        "writeOpsLastSample": 0,
        "zeroBlocks": 3573514
      }
    ]
  }
}
What else?
This isn't new to me, but if you haven't looked at these things before, ListVolumes method gives you volume properties (as opposed to ListVolumeStat which is about performance).
I removed unrelated items for easier viewing:
{
  "access": "readWrite",
  "accountID": 13,
  "attributes": {},
  "blockSize": 4096,
  "fifoSize": 5,
  "minFifoSize": 0,
  "name": "win2",
  "status": "active",
  "totalSize": 20000538624,
  "volumeID": 135,
  "volumePairs": [
    {
      "clusterPairID": 77,
      "remoteReplication": {
        "mode": "Async",
        "pauseLimit": 3145728000,
        "remoteServiceID": 5,
        "resumeDetails": "",
        "snapshotReplication": {
          "state": "Idle",
          "stateDetails": ""
        },
        "state": "Active",
        "stateDetails": ""
      },
      "remoteSliceID": 10,
      "remoteVolumeID": 10,
      "remoteVolumeName": "win2-replica",
      "volumePairUUID": "5f70fc08-fad6-465d-8dac-83766eb38ab4"
    }
  ]
}
Some replication-related stuff:
- access is readWrite as we'd expect on a source
- FIFO size, minimum FIFO size - default values related to queuing of replication backlog
- volume pairs is the main one here, it contains information about the configuration and state of replication
I almost forgot… See that snapshotReplication?
In any mode - Async, Sync, SnapshotsOnly - if we choose to enable replication in "Create Snapshot" options, the snapshot will be replicated and the state (Active or Idle) is also given in that JSON response.
"snapshotReplication": {
  "state": "Idle",
  "stateDetails": ""
}

I took this snapshot on Async volume, so - because there's no async delay in my case - the snapshot appeared at the destination in 1-2 seconds. I assume it would be "Active" if I was in SnapshotsOnly mode or async delay was measured in seconds or more.
All together now!
- at replication source: delay in Async replication (which the destination can't know on its own) and the state of replication from
ListVolumeStats - at replication source: replication status and configuration from
ListVolumes - at replication target: we can see the performance, time remaining, and volume ID of the target when initial sync is happening using
ListSyncJobs
Because I didn't need a working replication to extract replication configuration, I already added that to SFC last night. I'm still trying to figure out what should be fields and what tags, but the initial try is already on Github (it may change, but you may change it yourself as well!).
The other two - ListSyncJobs and (asyncDelay) ListVolumeStats - need to be added.
Conclusion
The monitoring of the initial volume copy and status isn't bad. If it doesn't work, then yes, you can't see much like I couldn't when working on Longhorny.
Initial volume sync is a one-off thing, so that information isn't very valuable unless you pair new volumes more than once (many people do it once and don't touch it for years). But if you do this, you can watch per-volume progress in Reporting > Running Tasks or via the CLI/API.
What seems more applicable to everyone is the need to monitor delay in async and snapshot replication and for any issues with synchronous replication.
If, for security or other reasons you can't be logged in to SolidFire Web UI all the time, consider using PowerShell or some monitoring tool that collects these metrics (maybe even SFC, if I implement it).
If you aren't even allowed to connect to the API endpoint (with PowerShell or something like SFC), you can still monitor these things by sending SolidFire log to Elasticsearch or other similar software. That's the most secure way because no one needs to access storage management interfaces on an ongoing basis.
Appendix A - replication metrics in SFC
This is an example of the initial implementation.
- Remote replication modes: Async (1), Sync (2), and SnapshotsOnly (3)
- State for snapshots and replication itself also uses integers to indicate status
- volume pair UUID (the last column in the first query) can be used to cross-reference volumes from different clusters, as it it's unique to each volume replication relationship (or "volume pair")
- Async delay is parsed and for volumes that are not paired, represented with the integer
-1, while0and higher stand for delay measured in seconds - Sync job (not shown)
> SELECT time,id,"name",account_id,access,remote_replication_mode,remote_replication_snap_state,remote_replication_state,remote_volume_id,remote_volume_name,volume_pair_uuid FROM "volumes" ORDER BY time DESC LIMIT 10
name: volumes
time                 id  name        account_id access    remote_replication_mode remote_replication_snap_state remote_replication_state remote_volume_id remote_volume_name volume_pair_uuid
----                 --  ----        ---------- ------    ----------------------- ----------------------------- ------------------------ ---------------- ------------------ ----------------
2024-06-15T13:30:12Z 172 syncJobTest 13         readWrite 1                       2                             1                        13               syncJob-replica    cfa9a820-2150-437c-b848-207c85975d1f
2024-06-15T13:30:12Z 136 sqldb       13         readWrite 1                       2                             1                        11               sql-replica        fba6dc63-993c-4a62-b85b-cb4043f04aae
2024-06-15T13:30:12Z 135 win2        13         readWrite 1                       2                             1                        10               win2-replica       5f70fc08-fad6-465d-8dac-83766eb38ab4
2024-06-15T13:20:12Z 172 syncJobTest 13         readWrite 1                       2                             1                        13               syncJob-replica    cfa9a820-2150-437c-b848-207c85975d1f
2024-06-15T13:20:12Z 136 sqldb       13         readWrite 1                       2                             1                        11               sql-replica        fba6dc63-993c-4a62-b85b-cb4043f04aae
2024-06-15T13:20:12Z 135 win2        13         readWrite 1                       2                             1                        10               win2-replica       5f70fc08-fad6-465d-8dac-83766eb38ab4
2024-06-15T13:10:12Z 172 syncJobTest 13         readWrite 1                       2                             1                        13               syncJob-replica    cfa9a820-2150-437c-b848-207c85975d1f
2024-06-15T13:10:12Z 136 sqldb       13         readWrite 1                       2                             1                        11               sql-replica        fba6dc63-993c-4a62-b85b-cb4043f04aae
2024-06-15T13:10:12Z 135 win2        13         readWrite 1                       2                             1                        10               win2-replica       5f70fc08-fad6-465d-8dac-83766eb38ab4
2024-06-15T13:00:12Z 172 syncJobTest 13         readWrite 1                       2                             1                        13               syncJob-replica    cfa9a820-2150-437c-b848-207c85975d1f
>
> SELECT time,id,"name",async_delay FROM "volume_performance" WHERE id=~/134/ or id=~/135/ or id=~/136/ ORDER BY time DESC LIMIT 15
name: volume_performance
time                 id  name  async_delay
----                 --  ----  -----------
2024-06-15T13:33:12Z 136 sqldb 3
2024-06-15T13:33:12Z 134 win1  -1
2024-06-15T13:33:12Z 135 win2  3
2024-06-15T13:32:12Z 134 win1  -1
2024-06-15T13:32:12Z 135 win2  0
2024-06-15T13:32:12Z 136 sqldb 0
2024-06-15T13:31:12Z 135 win2  0
2024-06-15T13:31:12Z 136 sqldb 0
2024-06-15T13:31:12Z 134 win1  -1
2024-06-15T13:30:12Z 136 sqldb 0
2024-06-15T13:30:12Z 134 win1  -1
2024-06-15T13:30:12Z 135 win2  0
2024-06-15T13:29:12Z 134 win1  -1
2024-06-15T13:29:12Z 135 win2  0
2024-06-15T13:29:12Z 136 sqldb 0
From the above it's obvious volume 172 (syncJobTest) is the only replicating volume and it is the source, while the remote volume is the replica.
Since from the first query we know syncJobTest has a pairing relationship with syncJob-replica (volume ID 13 on the remote cluster), we can also query (and visualize) pairs like this.
> SELECT time,id,"name",async_delay,cluster FROM "volume_performance" WHERE id= '172' or id= '13' ORDER BY time DESC LIMIT 15
name: volume_performance
time                 id  name            async_delay cluster
----                 --  ----            ----------- -------
2024-06-15T14:33:14Z 172 syncJobTest     -1          PROD
2024-06-15T14:32:40Z 13  syncJob-replica -1          DR
2024-06-15T14:32:14Z 172 syncJobTest     -1          PROD
2024-06-15T14:31:40Z 13  syncJob-replica -1          DR
2024-06-15T14:31:14Z 172 syncJobTest     -1          PROD
2024-06-15T14:30:40Z 13  syncJob-replica -1          DR
2024-06-15T14:30:14Z 172 syncJobTest     -1          PROD
2024-06-15T14:29:40Z 13  syncJob-replica -1          DR
2024-06-15T14:29:14Z 172 syncJobTest     -1          PROD
2024-06-15T14:28:40Z 13  syncJob-replica -1          DR
2024-06-15T14:28:14Z 172 syncJobTest     -1          PROD
2024-06-15T14:27:40Z 13  syncJob-replica -1          DR
2024-06-15T14:27:14Z 172 syncJobTest     -1          PROD
2024-06-15T14:26:40Z 13  syncJob-replica -1          DR
2024-06-15T14:26:14Z 172 syncJobTest     -1          PROD
You may notice now Async Delay for syncJobTest is -1. How is that possible? I changed its mode from Async to SnapshotsOnly, so there's no more "Async Delay". You can find more on these details in the SFC documentation for reference dashboard.
Here we got a short-lived remote sync job pushed on the remote cluster (notice the cluster name: DR), which took just a few seconds (not more than a minute, as we see just 2.25 seconds was left by the time SFC saw the job).
> select * from sync_jobs
name: sync_jobs
time                 blocks_per_sec cluster dst_volume_id elapsed_time pct_complete remaining_time    stage type
----                 -------------- ------- ------------- ------------ ------------ --------------    ----- ----
2024-06-15T14:48:40Z 101968         DR      11            1            31           2.225806451612903 data  remote