SFC v2 adds volume replication monitoring
- What replication monitoring?
- What does that mean?
- What can we see?
- Other implementation details
- Grafana aside
- Summary
What replication monitoring?
You can read about the topic of SolidFire replication monitoring in the previous post where I explain the background and the related SolidFire API methods.
This post is about an implementation in SFC v2 which, incidentally, is not really "ready" as I'm obviously still adding stuff to it, but I post all these to Github so it is available, just not yet as "SFC v2.0.0". Anyway, all these screenshots are taken with SFC v2 that you can get from Github.
What does that mean?
That means SFC now captures some replication-related stuff:
- at source: delay in Async replication (which the destination can't know on its own) and the state of replication
- at source: replication status and configuration
- at destination: we can see the performance, time remaining, and volume ID of the target when initial sync is happening
What can we see?
It may be good for those who have paired clusters which they use for volume and/or snapshot replication.
Here's an example (source: reference dashboard available in the repository) with "raw" data:

Negative 1? What's that?
Well, it's raw data, but processed. As I explained in the previous post, it's a choice of how one wants to implement it.
The choice has to be made regarding the value we want to assign to all non-paired volumes. Because if we take measurements of async delay for asynchronously replicating volumes, that figure goes from 0 to whatever is the maximum (I think 10 hours or something), so we can't have 0 for volumes that aren't even paired for any kind of replication, or maybe have snapshots-only replication. So I give all those guys a -1. 183 is the important one, though, we could highlight it with gradient or color range formatting and that would already be enough.
While in Grafana we can view raw data as it is, with a little effort it can be made better. Let's see an "enterprise" example (LOL).
Below, the topmost panel is the same thing as that green wonder above, but shown as a time-series chart. At (1) we manually suspended replication of 2 volumes because were were about to upgrade Windows and SQL Server and didn't want to replicate a possible disaster to the remote site. This suspension was done at the source.
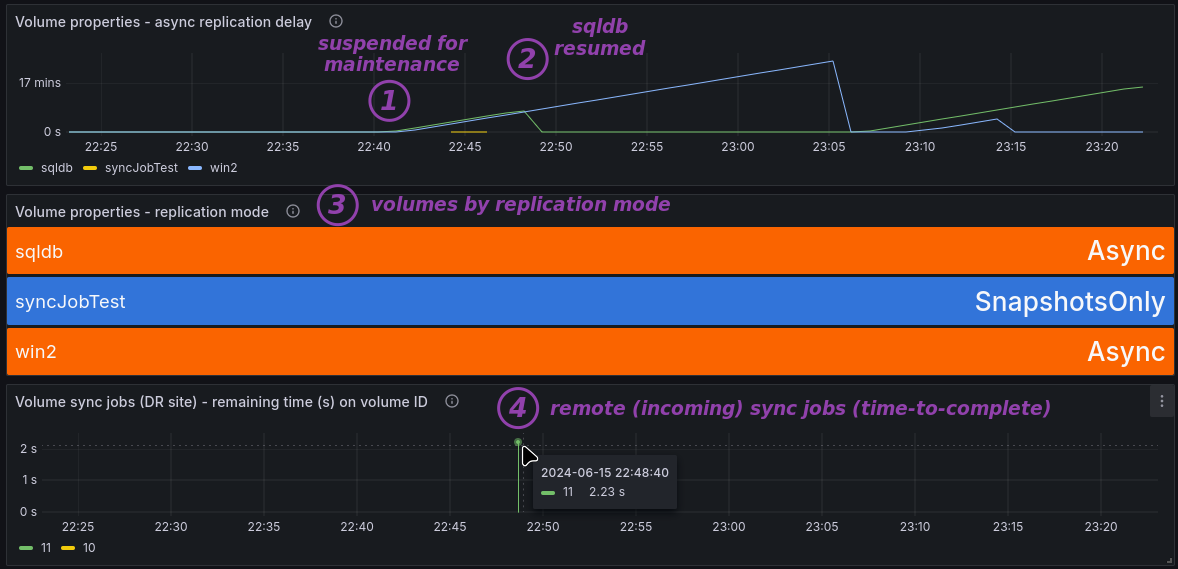
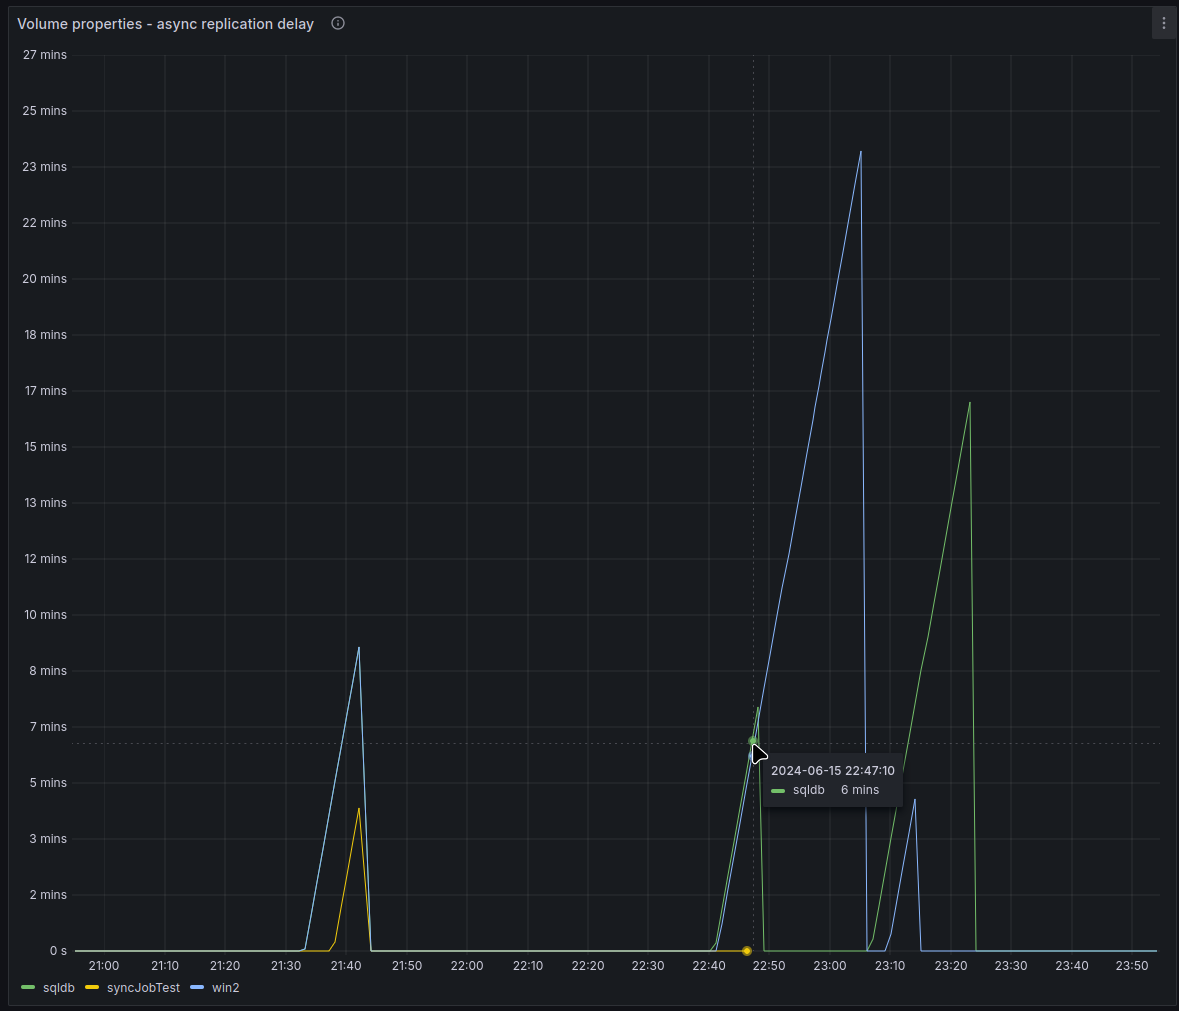
At (2) we resumed SQL DB volume some 6-7 minutes later (a larger version of the same panel is further below, shown in a longer 3-hour timeline).
In the middle three-panel screenshot (3) shows what's being replicated (volume names) and how (snapshots only - "cold"/blue, async - orange, sync - red). (I don't have anything in red because I don't have Sync because I use SolidFire Demo VMs, which in my case seem powerless to achieve Sync.)
Metrics in the panel at the bottom (with (4)) are collected by SFC running at the remote site. When a volume is un-paused or paired for the first time, "volume sync" jobs may - depending how frequently one looks and how short they last - be seen, and while we generally don't care about them except that we want them to finish and go away. The highest frequency of SFC collection is 60s, so a sync job may start and complete between two SFC collections and we won't even see it. That's not a problem, as we can watch replication delay for all volumes in (1). We could map volume IDs from (4) to volume names but like I said I don't want to track anything by name in that panel: I want that panel to be empty, and when it's not, that the green "time to complete" (in seconds) bar does not grow, but decline and quickly disappear. Another person may want to do it differently - it's just a reference panel.
There are some other details that are collected but not visualized in these examples.
This is the enlarged time series charte of async delays ((1), (2)).
Other implementation details
SFC still doesn't collect everything related to SolidFire replication. In this initial implementation:
- It collects only the first relationship of a paired volume. For users with two SolidFire clusters, that means it collects everything. For users with 3 or more clusters, it may not collect everything.
- There are several kinds of SolidFire sync jobs. Remote sync that's used for initial copy or re-sync is just one of them. If you're looking to monitor remote sync jobs, SFC does it. If you're looking to also monitor clone and whatever other jobs there are, SFC does not do that yet.
- Snapshot delay (similar to Async Delay, but for snapshots) is not yet captured; only the state of snapshot replication is. I don't know if snapshot replication delay can be larger than async delay. Maybe it can, but it's probably equal or shorter, so I'd say it's probably not that important to most users, unless you only replicate snapshots - then you won't have any Async Delay for Async replication collected.
These are simply my decisions for this initial implementation. I don't have three clusters or the list of all the possible replication states (and don't know who may be interested in that anyway), so I'm not going to spend weeks figuring that out.
If users with feedback (or God forbid, contributors) emerge, I may work on these limitations, if not, that's also fine - this will do.
Grafana aside
Grafana aside, in recent posts I mentioned how having a DB of metrics may let us manage better.
Take this example of volume sync jobs: although Grafana could show this in a table [1], this can be useful without Grafana. I can query my metrics database and find when volumes were synced and how fast (20000 blocks per second is ~80 MB/s).
> select * from sync_jobs
name: sync_jobs
time                 blocks_per_sec cluster dst_volume_id elapsed_time pct_complete remaining_time    stage type
----                 -------------- ------- ------------- ------------ ------------ --------------    ----- ----
2024-06-15T14:48:40Z 101968         DR      11            1            31           2.225806451612903 data  remote
2024-06-15T15:13:44Z 20404          DR      10            87           0            0                 data  remote
2024-06-15T15:14:44Z 20404          DR      10            87           0            0                 data  remote
2024-06-15T15:22:44Z 60269          DR      11            6            0            0                 data  remote
[1] Notice that in three of the result rows remaining time is 0. This means that when a resync job is starting, it's running, but data copying has not started yet (e.g. maybe it's comparing metadata between source and destination). While we can't see s*** in a Grafana panel that shows 0s as instructed, we could change the query to show pct_complete instead, or show the same panel result in a table.
I know that many storage admins often get questions about these details ("I synced a volume last night and it was very slow") and are usually unable to answer them ("I don't know, did you check with the network team?").
You can't get from the Web UI and from Active IQ either. In fact you may not be able to get it anywhere, unless you collect it yourself.
Summary
Two months ago I resumed work on SFC v2, in early May I had some updates, then step by step I got to where I wanted to get, not just monitoring-wise, but also configuration-wise - this month I also released Longhorny for replication configuration management.
Now a lot of things are in place for the remaining use cases I blogged about in early June.
For backup-to-S3 I still need to add bulk volume jobs, maybe support for other types of volume sync jobs would be nice to have, then there are volume attributes as well. If I implement volume attributes in SFC, I'll probably do a new measurement with volume ID, name, and all attributes - not just the first, like in the case of paired volume here where only one is currently supported - because I want to capture Trident's attributes and also additional ones explained in this post about use cases.
If I manage to achieve some of that, then I'll have most parts required to monitor SolidFire in Kubernetes environments, including during the period volumes are switched over, being synced back and fail-back. If you're interested in that, see the first step (mapping of Kubernetes PVCs to SolidFire Volumes) in this post.