Snapshots and snapshot schedules in SFC v2
Introduction
Similarly to the recent pattern where a post on some SolidFire API details is followed by a post on data collection and visualization in SFC, this one is as per the title and follows Snapshots and snapshot schedules in NetApp SolidFire.
Towards the end of that earlier post I said it looks deceivingly simple - just query and insert and then pick the data in Grafana - but this was even worse than I expected.
Schedules
One amazing thing about schedules is there's a bunch of different options and each API response has a mix of fields and data types that appear in one and not in another response depending on whether some other option was on or off.
The other problem is one can't really learn a lot from "visualizing" a schedule. The main thing is whether it succeeded or failed (scheduled snapshot, that is), but even in the SolidFire Web UI one can't learn much from that - we really need to go to Events or elsewhere.
If one tries to visualize a schedule, there's a lot of complexity in those responses. First, there's 3 kinds: interval-based (example: every X hours), day-of-week (ex: Mon-Fri, plus time), day-of-month (ex: every 5th) and a bunch of different options. There are even non-recurring schedules, where you can setup a day-of-month schedule that does not repeat. Crazy stuff for visualization…
While I'm sure a good programmer would find a way, but I couldn't. So I settled for time interval-only, and even that doesn't tell you much: you may see how frequently it's supposed to do something, but to see what happened you need to go to either Snapshots (or Group Snapshots), or Events (if it failed).
I now think this is more suitable for Elasticsearch, and less for Grafana.
Snapshots
Also surprisingly complex!
First, there are single volume snapshots and there are group snapshots.
Second, "sub-snapshots" from group snapshots are actually visible in regular snapshots, if you look in the non-default view Members (individual snapshots are under Individual).
If you list all snapshots, you get all snapshots - Individual and group-Member snapshots - and then you may eliminate all those with non-0 group ID membership to get only Individual snapshots. Or the other way around.
Again, it sounds simple until you realize that a volume may have both. Oops.
You may find it 17 times, 7 times as Individual snapshot, maybe 5 of those are manual and 2 scheduled, and 10 times in group snapshots. Each of these 17 may or may not be enabled for replication, and if it is, have or not have a remote copy (maybe it failed to transfer, for example).
To make things even more exciting, snapshot IDs (and group snapshot IDs) are the last memorable IDs in SolidFire.
You may remember some "prominent" volume IDs for critical DBs, or some account IDs (if you have half a dozen), or even QoS policy IDs.
But volume snapshots usually don't linger around - you create a schedule, set retention and before you know you have two dozen snapshot IDs per each volume, so with 100 volumes you may have 2000 snapshot IDs with a 50-100 churn rate per day. Very nice!
We can give them names, but still - you have 20 snapshots name "CRM", each with a meaningless snapshot ID like 2147, 2295, 2500, etc. Or maybe CRM-01, CRM-02, except that SolidFire can't increment names like that - it uses IDs and unless you create snapshots from own scheduler they'll either be named automatically by SolidFire, or all have the same name.
That doesn't mean they're impossible to handle - SolidFire handles them very well - but rather that in Grafana that becomes a problem.
Do you want to see a big panel with 50 snapshots by ID? No.
Do you want to see a big panel with 50 snapshots by volume name? Maybe yes, but you'd have to get the volume names in from the volumes "table". Grafana doesn't necessarily make that easy (some an example below).
Group snapshots
I've already said "snapshots" contain Group Snapshots, while Group snapshots are just logical groupings (by group ID) that identify "members".
Here, too, the problem is that group IDs don't mean much, and names do but you don't want to know a name, you want to know whether it worked and if members got replicated, which isn't even in the snapshots "table".
Enough bad news - let's see some examples.
Examples
This almost looks useful, except that it's the pretty Grafana UI playing games with our mind.
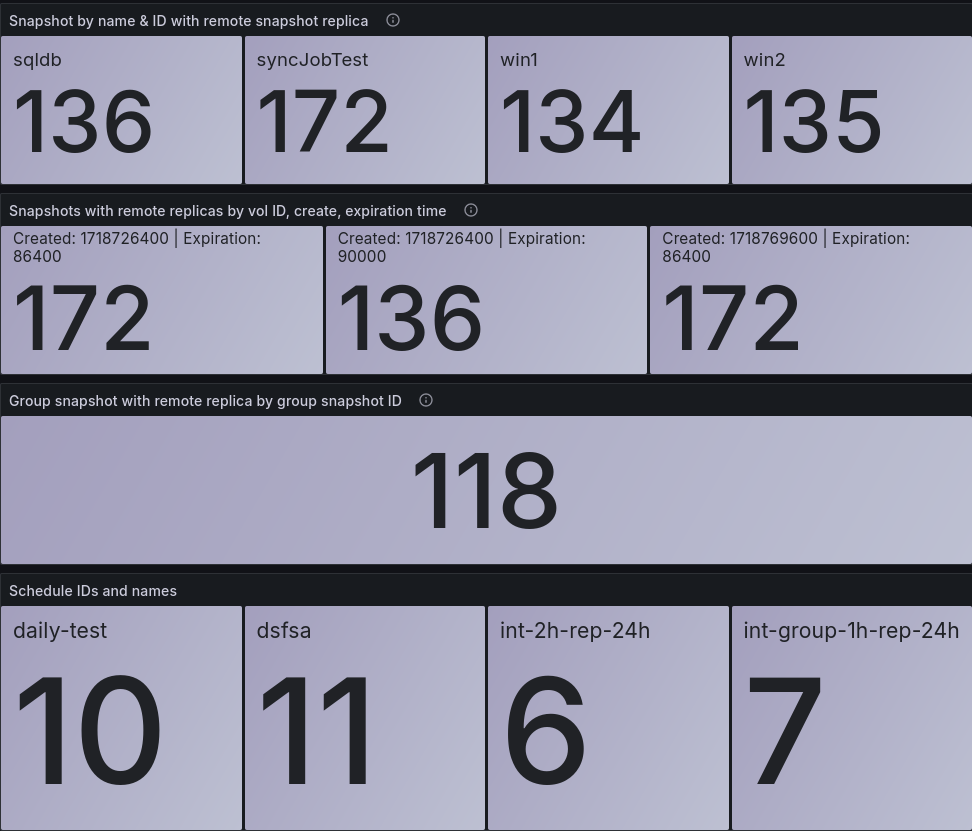
The first panel shows volumes by name and ID that have a remote snapshot replica. Sort of useful. Except that you can't see from when. Are those from 2023? Or from yesterday? The saving grace is you may know that volume pairing replication is configured to replicate snapshots to the remote site and retain them for 2 days, for example, so in the worst case the snapshots you see are less than 2 days old. This is semi-useful, but on the happy side I blogged how I've added replication monitoring to SFC so you actually have another place to look at the replication delay, for example.
The second panel throws in created time and expiration time. Amazing! Conversion to human time needs to be done by the user, but Grafana can do that for you. Why do I even need the first panel, then? Well, notice how each has different volume IDs: it's the same database table, but I can't get the same data from two different queries and there no single reason for that. It's complicated. Another example is that in this panel volume ID 172 shows up twice. Why? Because that's actually two different snapshots. We'd have to select the most recent create time, except that I can't make that work. The fact that I can't get volumes 134 and 135 show in that query is an even bigger problem that I also don't know how to solve.
The third useless panel shows volume group ID (118, as if that's supposed to tel you something) that (a) is configured for remote replication, and (b) has a remote replica present on the remote cluster. Okay, that's not bad if you have several group snapshots for your scale-out databases and want to make sure they all show up here. But I'd rather find a different way to visualize that, e.g. by looking at replication delay Stat counter for those 10-20 volumes in the volumes chart. There's nothing wrong with the data, it's just that it doesn't tell you much. enable_remote_replication is 1 and status is 1, which is what the panel shows.
> select * from snapshot_groups
name: snapshot_groups
time                 cluster create_time enable_remote_replication expiration_time grp_snapshot_id grp_snapshot_id_1 grp_snapshot_name  members remote_grp_status status
----                 ------- ----------- ------------------------- --------------- --------------- ----------------- -----------------  ------- ----------------- ------
2024-06-19T15:46:49Z PROD    1718726400  1                         90000           118             118               group-sql-snapshot 3       1                 1
2024-06-19T15:56:45Z PROD    1718726400  1                         90000           118             118               group-sql-snapshot 3       1                 1
2024-06-19T16:06:46Z PROD    1718726400  1                         90000           118             118               group-sql-snapshot 3       1                 1
The last panel is schedule IDs and names, also not very useful, unless we show schedule ID in some of them snapshot panels. Again, there's more that can be showed, including has_error (0 means no error), but like I said these are really configuration factoids and not metrics, so Elasticsearch would be more appropriate than InfluxDB for this.
> select * from schedules
name: schedules
time                 cluster enable_remote_replication enable_serial_creation has_error last_run_status paused recurring run_next_interval schedule_id schedule_name        schedule_type snapshot_name        volume_count
----                 ------- ------------------------- ---------------------- --------- --------------- ------ --------- ----------------- ----------- -------------        ------------- -------------        ------------
2024-06-19T15:46:42Z PROD    1                         1                      0         1               0      1         0                 6           int-2h-rep-24h       Snapshot      int-2h-rep-24h       1
2024-06-19T15:46:42Z PROD                                                     0         1               0      1         0                 11          dsfsa                Snapshot      dsfsa                1
2024-06-19T15:46:42Z PROD    1                                                0         1               0      1         0                 7           int-group-1h-rep-24h Snapshot      int-group-1h-rep-24h 3
There's another point - I just noticed in this SQL output so I'll mention it - it would seem wise to not store 0 where the API returns nothing. It just creates more IO and takes up more space, and yet it doesn't give mor insight.
We want to know if "enable_remote_replication" value is 1 and if it's not we know volume snapshots aren't being replicated.
The other problem is that some API responses simply do not have anything in them because if the option isn't enabled, it may not even show in API responses. That's why some columns have 0s and some don't, and populating those missing values with 0s may even be misleading.
And I wonder if null values impact either (or both) Influx and Grafana queries which may be why some volumes refuse to show up in panels. Another example is below - the second panel from the larger screenshot above.

Approximately every 10th refresh InfluxDB returns query parameters in another order and messes up my Grafana transformations until next refresh cycle which in Auto (1 min) mode means if you look 5-10 minutes you may notice it, just enough to annoy you. I don't know if that's a Grafana bug or something else.
The good news
It's mostly the bad news, but there are some good news, too. Data that's collected - to the extent that it's accurate, but it will take more than a single user to find that out - is valid and readily usable.
We can easily query this from anywhere, including Influx CLI or Python or PowerShell, to get data or reports. That works fine. Recently reported snapshot metrics:
> SELECT * FROM snapshots WHERE time > '2024-06-19T18:06:47Z'
name: snapshots
time                 cluster create_time enable_remote_replication expiration_delta group_id new_snapshot_name                             remote_status snapshot_id status volume_id volume_name                              volume_pair_uuid
----                 ------- ----------- ------------------------- ---------------- -------- -----------------                             ------------- ----------- ------ --------- -----------                              ----------------
2024-06-19T18:16:44Z PROD    1710984705  0                         434860094        0        snapshot-3b5f2fb6-462d-4ae3-8a33-a8b21333b79c 0             252         1      111       pvc-8d31e43b-f942-4cf8-94db-a08762c745ee 0
2024-06-19T18:16:44Z PROD    1712614181  0                         433230618        0        velero-vol-136-202404090609Z                  0             438         1      136       sqldb                                    0
2024-06-19T18:16:44Z PROD    1712614787  0                         433230012        0        velero-vol-136-202404090619Z                  0             439         1      136       sqldb                                    0
Even that darn second panel above, it's easy to query InfluxDB and get all the replicated snapshots from snapshot group ID 118 reported in the last 30 minutes. The actual snapshot creation time for all 3 volumes (as it's a Consistency Group) was 1718726400 which was Tuesday, June 18, 2024 4:00:00 PM (UTC) and this schedule keeps snapshots at the remote site for 25 hours (expiration delta 90000 seconds).
> SELECT * FROM snapshots WHERE group_id=118 AND time > (now()-30m) ORDER BY time DESC LIMIT 3
name: snapshots
time                 cluster create_time enable_remote_replication expiration_delta group_id new_snapshot_name  remote_status snapshot_id status volume_id volume_name volume_pair_uuid
----                 ------- ----------- ------------------------- ---------------- -------- -----------------  ------------- ----------- ------ --------- ----------- ----------------
2024-06-19T18:16:44Z PROD    1718726400  1                         90000            118      group-sql-snapshot 1             813         1      136       sqldb       fba6dc63-993c-4a62-b85b-cb4043f04aae
2024-06-19T18:16:44Z PROD    1718726400  1                         90000            118      group-sql-snapshot 1             811         1      134       win1        e1f4469e-034a-4a01-af26-ad75b2c9f48b
2024-06-19T18:16:44Z PROD    1718726400  1                         90000            118      group-sql-snapshot 1             812         1      135       win2        5f70fc08-fad6-465d-8dac-83766eb38ab4
I may not be able to present this in Grafana in a visually appealing way, but I can create queries to get data that I no longer exist on SolidFire or in NetApp AIQ, or may take many hours of clicking around and copy-pasting to figure it out (while you make mistakes copy-pasting to Excel or Notepad).
If you scroll the above query all the way to the right, you'll see the last column is volume_pair_uuid. This volume is paired and the volumes "table" has this information.
SFC (by default) updates the volumes table every 10 minutes, so by querying the volumes measurement for that volume pair UUID in last 15 minutes I expect a single match if I have SFC only on one site, or two if the destination has an SFC instance sending data to the same InfluxDB.
Abbreviated response with many columns omitted:
> SELECT * FROM volumes WHERE volume_pair_uuid = '5f70fc08-fad6-465d-8dac-83766eb38ab4' AND time > (now()-15m)
name: volumes
time                 remote_replication_mode remote_replication_snap_state remote_replication_state remote_volume_id remote_volume_name
----                 ----------------------- ----------------------------- ------------------------ ---------------- ------------------
2024-06-19T18:26:37Z 3                       2                             2                        10               win2-replica
- Replication mode 3 is SFC representation for "SnapshotsOnly" mode of replication
- Remote replication state 2 is "Idle" (so, no backlog or ongoing synchronization)
- Remote volume ID and Name at the remote site are 10 and win2-replica, respectively. That's the other half of the volume pair.
That's the information shown in the replication monitoring post from few days ago, except there you don't need to know about the codes because it's a panel that shows replication delay in seconds.
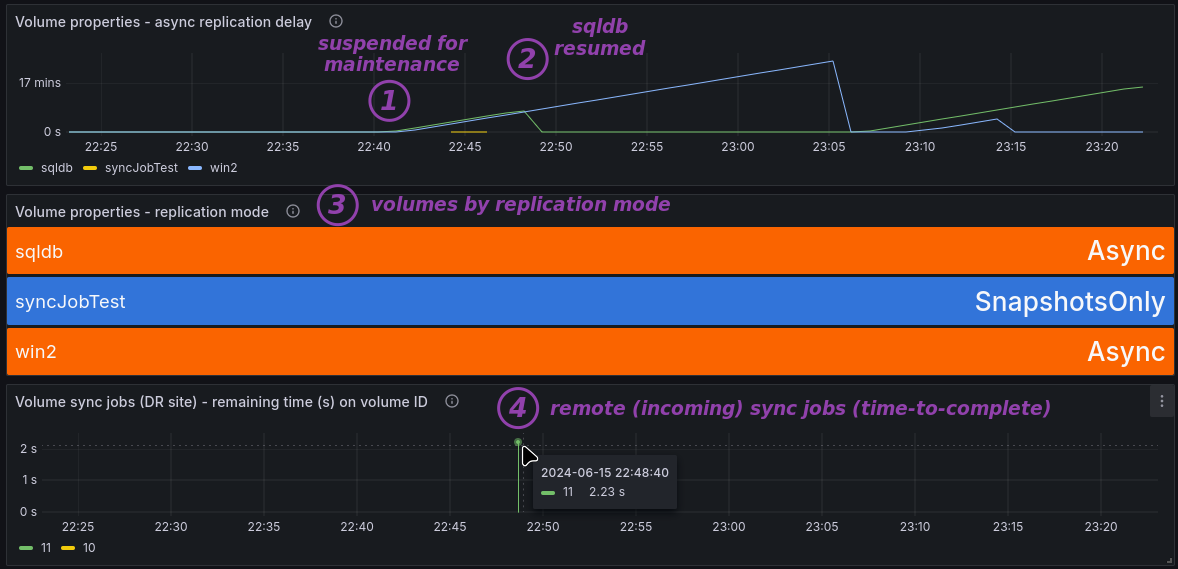
If we need to quickly produce a list of paired volumes or a point-in-time report on all volume relationships and replication delays, we probably want to use SQL (or InfluxQL, in this case) rather than Grafana.
Getting this info would be easier in Elasticsearch, but this isn't too bad.
For a comparison, I don't think this is even possible in NetApp Active IQ or in the SolidFire API (considering that only current metrics are available and nothing is retained) no matter how much time you are willing to spend or what skills you posses.
Conclusion
Snapshots and schedules aren't a good use case for SFC and on top of that I did a lousy job coding these features, too. Not that "it doesn't work" (maybe in some cases it does not) but rather that it was clearly written solving problems "on the fly". I even had a plan, but the API, InfluxDB and Grafana punched me in the face.
Additionally, my implementation took some shortcuts and made inevitable compromises.
The schedules cover only time interval-based schedules. In many cases and after many attempts to avoid that, I just had to resort to replacing string responses (ex: "Done", "Success") with integers (ex: 1) and the schedules table reminds me of one that I must remember to document, which is that the last column (volume_count) doesn't exist in SolidFire API responses (I compute it to find a compromise between omitting information and using too much storage space).
There are trade-offs and while I'd prefer to send this data to Elasticsearch, SFC is a very lightweight application and InfluxDB is relatively small as well, so I think these are reasonable compromises to avoid adding too much complexity to the code, too much useless data to storage and so on.
Now that this collection works, it's not hard to send data to Elasticsearch (or elsewhere) if you want to. There's already a detailed how-to for SolidFire logging to Elasticsearch, so combined with either data import from InfluxDB or the modified SFC code to send measurements to Elasticsearch, it's a choice we can implement in addition to or instead of SFC with InfluxDB.
I will take me a few days to tidy up and document the added measurements, but I think now I have almost everything I want except volume attributes (required for various Kubernetes/Trident-related use cases) and bulk volume jobs (SolidFire's backup to S3, or backup-to-another-SolidFire). After these two features are added, then I may revisit Kubernetes-related use cases including Kubernetes and storage failover/failback and Kubernetes backup, to see if this data in InfluxDB is any helpful.