Splunk Operator for Kubernetes with NetApp E-Series
Splunk Operator for Kubernetes (SOK) with NetApp E-Series
I haven't used Splunk since this post in late 2023. That post was more about sizing and performance testing, but even that was too much since no one has ever asked me anything about it.
Still, back then, E-Series didn't have any accessible CSI options (vSphere CSI was only theoretically available to me). Now, we have several, so I had to give SOK (Splunk Operator for Kubernetes) a try in order to see just how difficult that is.
SOK can be downloaded here and is documented here.
The SOK challenge
Turns out - I didn't have to do anything to make it work.
- I had IBM Block CSI 1.13.1 with SANtricity patch released just last week
- I only patched my existing Storage Class (I made it the default Kubernetes SC) in order to avoid having to read the SOK documentation on PVC management
- Then I installed SOK, accepted the Splunk license, and deployed singleton Splunk cluster based on Splunk 10.2
wget -O splunk-operator-cluster.yaml https://github.com/splunk/splunk-operator/releases/download/3.1.0/splunk-operator-cluster.yaml
kubectl apply -f splunk-operator-cluster.yaml --server-side
Installation (also copy-paste from the SOK docs):
cat <<EOF | kubectl apply -n splunk-operator -f -
apiVersion: enterprise.splunk.com/v4
kind: Standalone
metadata:
  name: s1
  finalizers:
  - enterprise.splunk.com/delete-pvc
EOF
And, just like that, I've deployed Splunk 10.2 on Kubernetes with NetApp E-Series.
$ kubectl splunk -n splunk-operator -l apps.kubernetes.io/pod-index=0 exec status
splunkd is running (PID: 827).
splunk helpers are running (PIDs: 828 1013 1018 1116 1117).
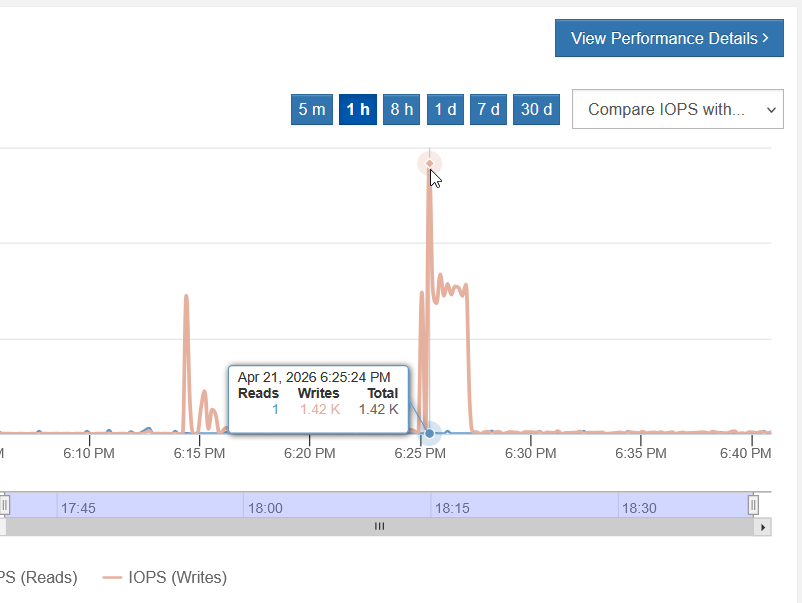
Workload-wise, there wasn't much to see, as I haven't tested that. IOPS spiked when I was installing, but that was all.
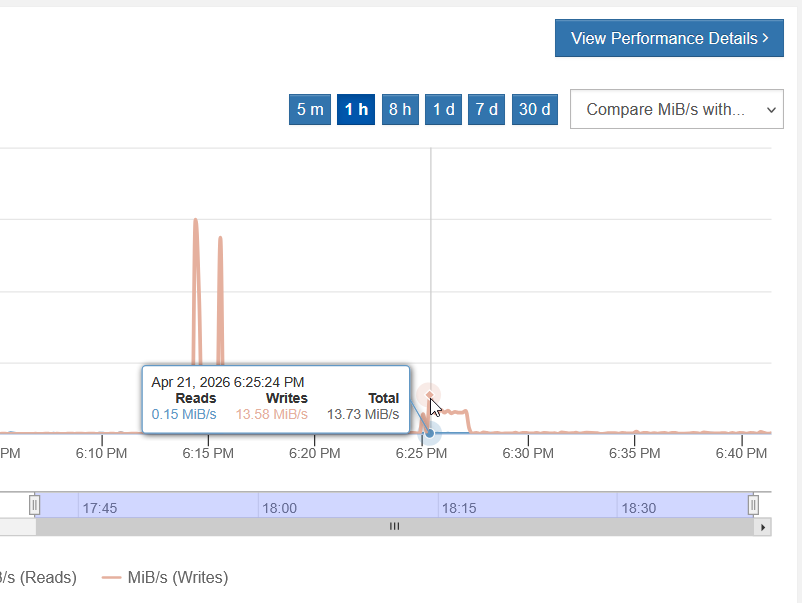
When Splunk cluster started, I saw 13 MB/s until it settled.
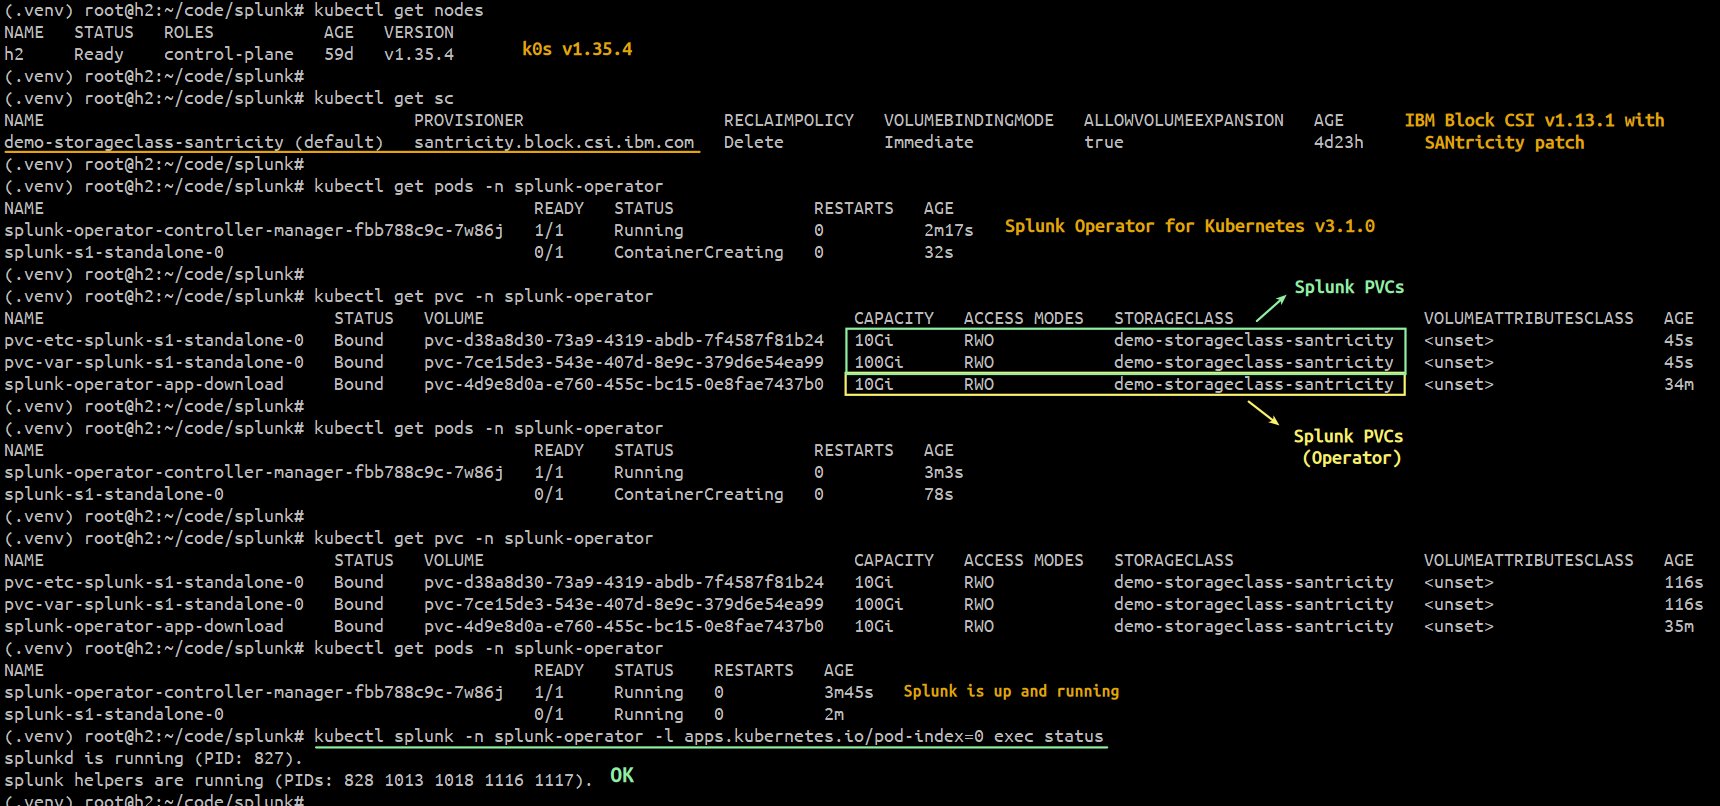
The whole process was literally just 10 shell commands.
Now, that's not to say that's all you need to know to run Splunk clusters. Far from that!
But that's a lot of what you need to know about using E-Series in a Kubernetes environment:
- Create a DDP
- Specify you want to use that storage pool
- Create a Storage Class that uses RAID 1
The same recipe applies to SANtricity CSI.
Conclusion
From that older Splunk-with-SmartStore post we already knew E-Series easily delivers (and that was before EF80 came out!) what Splunk Hot/Cache Tier requires: fast performing, reliable protected storage without complexity.
CSI-wise, I was pleased to see that IBM Block CSI with SANtricity patches worked fine. I literally did not have to do anything to make it work.
Now we know these CSI volumes work just like any other - create, map, rescan/connect - but after trying another highly popular analytics solution the other day, I must say I like it. These things just work!
People may say "yeah, but you're running singleton clusters". Yeah, but that's very close to how it's actually supposed to be done.
Like I said in the that post with the "other analytics solution", you're not supposed to centralize, consolidate and pile up Splunk (or other NOSQL) databases on one box and have Splunk running in 64 containers connected to one storage array. It's supposed to be distributed. Both Splunk and S3 used by SmartStore.
If you had a three-rack solution, you'd have three E/EF Series boxes and SANtricity CSI could be deployed once per rack, three times within the same Kubernetes cluster. S3 would also be distributed across racks and you'd have redundancy across racks for compute, block and object storage.
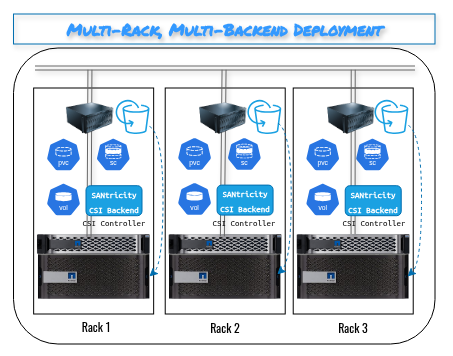
In other words, rather than buying one EF80 box, you should consider three entry-level EF300 boxes instead (at least if you want avoid losing SIEM or other precious logs in case a rack loses power or network connectivity - you'd still have the other two, together with storage in them, fully functional and available).
You can even run SOK with E-Series without any super-dynamic HA CSI setup. Just provision all the capacity in RAID 1 to workers and use TopoLVM. That also works.
With an "HA CSI" like IBM Block CSI with SANtricity patch (or SANtricity CSI, or vSphere CSI), SOK will attempt to restart failed Splunk pods on other schedulable workers. That helps avoid partial data reconstruction, but Hot Tier on RAID 1 should be "very re-buildable" (several TB in less than an hour?) and HA CSI is merely something that's "nice to have".
Currently neither IBM Block CSI with SANtricity patch nor SANtricity CSI support SANtricity CSI snapshots (although - from earlier today - that's work in progress). That is exactly why I mention it here: with modern Kubernetes-based applications such as Splunk, there's nothing you could do with CSI snapshots if you had them. There's no role for them. I expect IBM Block CSI with SANtricity patch will support SANtricity CSI snapshots soon, but you simply don't need that. Both of these CSI drivers already deliver the few, basic CSI storage features SOK needs. (Update (2026/04/22): single volume snapshots are available and might even work.)
Appendix A: SOK on NetApp E-Series
# kubectl describe pod splunk-s1-standalone-0 -n splunk-operator
Name:             splunk-s1-standalone-0
Namespace:        splunk-operator
Priority:         0
Service Account:  default
Node:             h2/10.x.x.x
Start Time:       Tue, 21 Apr 2026 17:13:08 +0000
Labels:           app.kubernetes.io/component=standalone
                  app.kubernetes.io/instance=splunk-s1-standalone
                  app.kubernetes.io/managed-by=splunk-operator
                  app.kubernetes.io/name=standalone
                  app.kubernetes.io/part-of=splunk-s1-standalone
                  apps.kubernetes.io/pod-index=0
                  controller-revision-hash=splunk-s1-standalone-544fc585bd
                  statefulset.kubernetes.io/pod-name=splunk-s1-standalone-0
Annotations:      traffic.sidecar.istio.io/excludeOutboundPorts: 8089,8191,9997
                  traffic.sidecar.istio.io/includeInboundPorts: 8000,8088
Status:           Running
...
Events:
  Type     Reason                  Age    From                     Message
  ----     ------                  ----   ----                     -------
  Warning  FailedScheduling        10m    default-scheduler        0/1 nodes are available: pod has unbound immediate PersistentVolumeClaims. preemption: 0/1 nodes are available: 1 Preemption is not helpful for scheduling.
  Warning  FailedScheduling        10m    default-scheduler        0/1 nodes are available: pod has unbound immediate PersistentVolumeClaims. preemption: 0/1 nodes are available: 1 Preemption is not helpful for scheduling.
  Normal   Scheduled               10m    default-scheduler        Successfully assigned splunk-operator/splunk-s1-standalone-0 to h2
  Normal   SuccessfulAttachVolume  10m    attachdetach-controller  AttachVolume.Attach succeeded for volume "pvc-d38a8d30-73a9-4319-abdb-7f4587f81b24"
  Normal   SuccessfulAttachVolume  10m    attachdetach-controller  AttachVolume.Attach succeeded for volume "pvc-7ce15de3-543e-407d-8e9c-379d6e54ea99"
  Normal   Pulling                 10m    kubelet                  spec.containers{splunk}: Pulling image "splunk/splunk:10.2.0"
  Normal   Pulled                  9m13s  kubelet                  spec.containers{splunk}: Successfully pulled image "splunk/splunk:10.2.0" in 1m32.816s (1m32.816s including waiting). Image size: 1916212022 bytes.
  Normal   Created                 9m13s  kubelet                  spec.containers{splunk}: Container created
  Normal   Started                 9m12s  kubelet                  spec.containers{splunk}: Container started
  Warning  Unhealthy               8m14s  kubelet                  spec.containers{splunk}: Startup probe failed:

$ kubectl get pods -n splunk-operator
NAME                                                 READY   STATUS    RESTARTS   AGE
splunk-operator-controller-manager-fbb788c9c-7w86j   1/1     Running   0          12m
splunk-s1-standalone-0                               1/1     Running   0          11m
Above you can see it took about 2 minutes to install - from the moment PVC request appeared, to the moment startup probe failed once.
Among the more or less noteworthy details: 120 GiB - remember, no thin-provisioning on EF-Series - is "recommended" to deploy SOK (10 GiB) and Splunk 10.2 (110 GiB), just in case you want to try this at home and can't use thin volumes. Maybe you can cut corners by fiddling with the operator deployment settings and do it with less. If your array supports thin provisioning, then there isn't much to worry about.
$ kubectl get nodes
NAME   STATUS   ROLES           AGE   VERSION
h2     Ready    control-plane   59d   v1.35.4

$ kubectl get sc
NAME                                     PROVISIONER                    RECLAIMPOLICY   VOLUMEBINDINGMODE   ALLOWVOLUMEEXPANSION   AGE
demo-storageclass-santricity (default)   santricity.block.csi.ibm.com   Delete          Immediate           true                   4d23h

$ kubectl get pods -n splunk-operator
NAME                                                 READY   STATUS              RESTARTS   AGE
splunk-operator-controller-manager-fbb788c9c-7w86j   1/1     Running             0          2m17s
splunk-s1-standalone-0                               0/1     ContainerCreating   0          32s

$ kubectl get pvc -n splunk-operator
NAME                             STATUS   VOLUME                                     CAPACITY   ACCESS MODES   STORAGECLASS                   VOLUMEATTRIBUTESCLASS   AGE
pvc-etc-splunk-s1-standalone-0   Bound    pvc-d38a8d30-73a9-4319-abdb-7f4587f81b24   10Gi       RWO            demo-storageclass-santricity   <unset>                 45s
pvc-var-splunk-s1-standalone-0   Bound    pvc-7ce15de3-543e-407d-8e9c-379d6e54ea99   100Gi      RWO            demo-storageclass-santricity   <unset>                 45s
splunk-operator-app-download     Bound    pvc-4d9e8d0a-e760-455c-bc15-0e8fae7437b0   10Gi       RWO            demo-storageclass-santricity   <unset>                 34m

$ kubectl get pods -n splunk-operator
NAME                                                 READY   STATUS              RESTARTS   AGE
splunk-operator-controller-manager-fbb788c9c-7w86j   1/1     Running             0          3m3s
splunk-s1-standalone-0                               0/1     ContainerCreating   0          78s

$ kubectl get pvc -n splunk-operator
NAME                             STATUS   VOLUME                                     CAPACITY   ACCESS MODES   STORAGECLASS                   VOLUMEATTRIBUTESCLASS   AGE
pvc-etc-splunk-s1-standalone-0   Bound    pvc-d38a8d30-73a9-4319-abdb-7f4587f81b24   10Gi       RWO            demo-storageclass-santricity   <unset>                 116s
pvc-var-splunk-s1-standalone-0   Bound    pvc-7ce15de3-543e-407d-8e9c-379d6e54ea99   100Gi      RWO            demo-storageclass-santricity   <unset>                 116s
splunk-operator-app-download     Bound    pvc-4d9e8d0a-e760-455c-bc15-0e8fae7437b0   10Gi       RWO            demo-storageclass-santricity   <unset>                 35m

$ kubectl get pods -n splunk-operator
NAME                                                 READY   STATUS    RESTARTS   AGE
splunk-operator-controller-manager-fbb788c9c-7w86j   1/1     Running   0          3m45s
splunk-s1-standalone-0                               0/1     Running   0          2m
In that last line Ready is 0/1 but that was before the first health probe passed. The pod was already up and running.