Proxmox PVE 9.1.1 (Debian) with NetApp EF-Series NVMe/RoCE
Introduction
Today I wanted to work on something useful - such as host-side interface reporting for various SANtricity-related libraries I maintain - but instead I spent hours dealing with custom URL blocking filters and "clarifying" my take on this this NetApp KB (see this Linux NVMe/RoCE post for additional details), which is what follows below.
I'll also add some notes on NetApp E-Series storage configuration options for PVE.
UPDATE: I've published a minimal basic santricity_lvm plugin for anyone who may want to take that route, as well as a better way, a PowerShell TUI for SANtricity with Proxmox VE 9. See this post for more. Both of these make it easier to consume E-Series iSCSI and NVMe/RoCE block using "shared storage LVM" and "DAS pattern for single host SDS/fileystems" and can be easily expanded.
E-Series and PVE storage options
Storage options
The official PVE storage options are here.
| Description | Plugin Type | Level | Shared | Snapshots | Comment |
|---|---|---|---|---|---|
| Backup | pbs |
both | yes | yes | Install on BM svr & E/EF |
| LVM | lvm |
block | yes | yes | Big/Med VMs & CTs |
| ZFS (local) | zfspool |
both | no | yes | Small CTs & VMs |
| Directory | dir |
file | no | yes | Small CTs & VMs |
| Btrfs | btrfs |
file | no | yes | Small CT & VMs |
| CephFS | cephfs |
file | yes | yes | Many VMs & Containers |
| Ceph/RBD | rbd |
block | yes | yes | Many VMs & Containers |
iSCSI/kernel, rdma/kernel |
block |
block | yes | no | Big VMs; I made up rdma/kernel |
| NFS | nfs |
file | yes | yes | Linux NFS VM req'd, see how-to |
Storage efficiency comparison
Several options offer good compression, and since E-Series has no efficiencies, these are highly recommended for compressible data.
| Description | Efficiency | Recommendation |
|---|---|---|
| Backup | yes | Compression (default: on) |
| LVM | no | - |
| ZFS | yes | Compression only |
| Btrfs | yes | Compression only |
| CephFS | yes | Compression & selective deduplication |
| Ceph/RBD | yes | Compression & selective deduplication |
| iSCSI/kernel, rdma/kernel | no | - |
| NFS | no | Compression (Linux ZFS VM) |
With 2x compression savings common, in-cluster replication makes single-host storage options economically neutral as you end up using not more storage that you'd use anyway if you were on shared LVM storage or iSCSI/kernel (RDMA/kernel) without compression on E-Series.
Remember that regardless whether compression is enabled or not, you can also choose algorithms and even compression levels, depending on content or CPU resources.
Volume (LUN) mapping comparison
Remember to present (map) LUNs (namespaces) to individual hosts, not groups, when it is not desirable to make them visible to all hosts, as that may prevent accidental corruption.
| Description | Host or Host Group (Cluster) | Comment |
|---|---|---|
| Backup | either | Host Group for HA-clustered PBS, Host for stand-alone PBS |
| LVM | host group | needed for HA |
| ZFS | host | in-cluster replication for HA |
| Btrfs | host | in-cluster replication for HA |
| CephFS | either | Host (use E-Series as internal DAS disks) aligns better with Ceph management concepts |
| Ceph/RBD | either | Host (use E-Series as internal DAS disks) aligns better with Ceph management concepts |
| iSCSI/kernel, RDMA/kernel | host group | needed for HA |
| NFS | host group | needed for HA of Linux NFS VM |
If you perform manual failover of E-Series volumes mapped to single PVE host, you can remap those from the SANtricity UI or via API (or the SANtricity CLIs I've created) and then "import" such filesystems. That's still better than exposing them to multiple hosts at the same time.
Shared vs. host-only
- Proxmox Backup Server isn't really "storage". It's a backup repository (the concept is similar to Rest Server) that works with E-Series storage. I recommend installing it on a single stand-alone bare metal server, or a single-host PVE system, or a dedicated PVE-PBS cluster (depending on needs; the last would likely use LVM and ext4/XFS for HA) and setup replication if you need HA and DR. Backups arrive to PBS pre-compressed and coarsely deduplicated, so in this case ZFS'es compression doesn't save almost any space. See this post for more.
- Recommended: LVM is what saves space (by avoiding in-cluster duplication) and provides HA to PVE cluster. In PVE 8, host-side snapshots weren't possible, but in version 9 they are.
- E-Series can't have thousands of volumes per storage pool, so this would be fine for 200 VMs (or 100 VMs with 2 volumes each) per storage pool. On EF arrays you can have over 500 LUNs across two DDP (12 disks, one reserve) pools - not a huge number, but with 10 VMs per volume, that's still enough for 1,000 VMs
- If you have hundreds of workloads, I recommend to keep the large and medium VMs on LVM and offload "bulk" workloads to single host storage or Ceph
- Shared = yes in the case of LVM means that while storage is shared, it's not used at the same time by all (as it is on NFS or Ceph); a planned or unplanned failover event is needed for the storage to be shared by another host.
- Sharing is non-concurrent, LUN-based, so whatever is on a LUN needs to be able to run on the PVE host that takes it over. It is therefore recommended to have several LUNs per host. Example: 3 PVE hosts and 9 LUNs for LVM. Then you can use HA groups for failover (see here).
- Recommended: single host storage: these use internal disks or E-Series volumes mapped to, and mounted by, individual PVE hosts. Because there's no HA here, you maybe don't need HA (say, you use Kubernetes with stateless containers for front-end services)
- If you do need HA, use LVM. If you have very many workloads and can't put everything on LVM volumes, then move these workloads to Kubernetes either Ceph (see below), or "native" (check out HA CSI drivers for E-Series, as you'd need HA CSI) or use PVE's inter-cluster (host-to-host) replication (since these workloads are often small and don't need VM/LXC backup, replication might be inexpensive)
- ZFS is popular, "directory" is good, Btrfs is "technology preview". ZFS (local) can be installed on single-host E-Series LUNs, especially in DAS environments; since there's no HA without in-cluster replication, set it up in PVE. See the Proxmox Wiki page for more on ZFS. The same goes for other types, but among single-host options ZFS has file sharing and compression and Btrfs have compression** and Btrfs is less mature
- Ceph: Proxmox has own Ceph packages. I haven't used those, but you could use "single host storage" (map one LUN to each individual PVE host) and configure Ceph on it. You can use RAID 0 if you plan to use Erasure Coding on Ceph, or no replication if you use DDP volumes. Recommended for larger clusters with > 1,000 VMs and/or LXC containers. See here for more.
- Note that Ceph appears twice - as file server with NFS gateways and as RADOS block storage. The only reason I don't recommend it is complexity; LVM and single host storage should be easier to manage for up to 1,000 VMs/CTs
- iSCSI/kernel dedicates entire E-Series volumes to VMs, and snapshots are only available from (storage) hardware, so this isn't as good as LVM in PVE 9.
- NFS isn't included with E-Series, but you can deploy it as a highly-available VM in your PVE cluster. I have a post dedicated to Linux NFS/RDMA on NVMe/ROCE-backed LVM in this post which includes many details including performance and more. I don't recommend this for the important/critical VMs/CTs, but it may be a useful place for a bunch of low-priority, especially front-end, workloads.
LVM with snapshots
LVM is what "most people" would use and it's similar to how you may imagine Active-Passive KVM HA clusters would work. I haven't properly tested it with E-Series myself - it needs multiple hosts - but I tried iSCSI/kernel with a multi-node PVE 8 cluster and SolidFire and failover worked. PVE 9 isn't worse and E-Series supports SCSI-3 reservations and so on.
What drove me nuts is the UI, so here's how it worked over NVMe/RoCE with EF600.
First, on E-Series, create a host group (aka cluster) and add your PVE cluster members to it (use the right NQN (or IQN with iSCSI) when adding them). Then create a volume - at least one - and map it to this host group (or a pair, if you plan to use HA pairs for failover in PVE cluster).
Then on all hosts re-scan storage to make sure the target is visible.
After that go to a host, any host from the group the LUN is mapped, to create a VG for the first, highly available LVM on E-Series. If you add storage, that volume would be added right away. If you do not add storage, you'll need to create an LVM. I did not create LVM in this workflow, to better showcase what it entails.
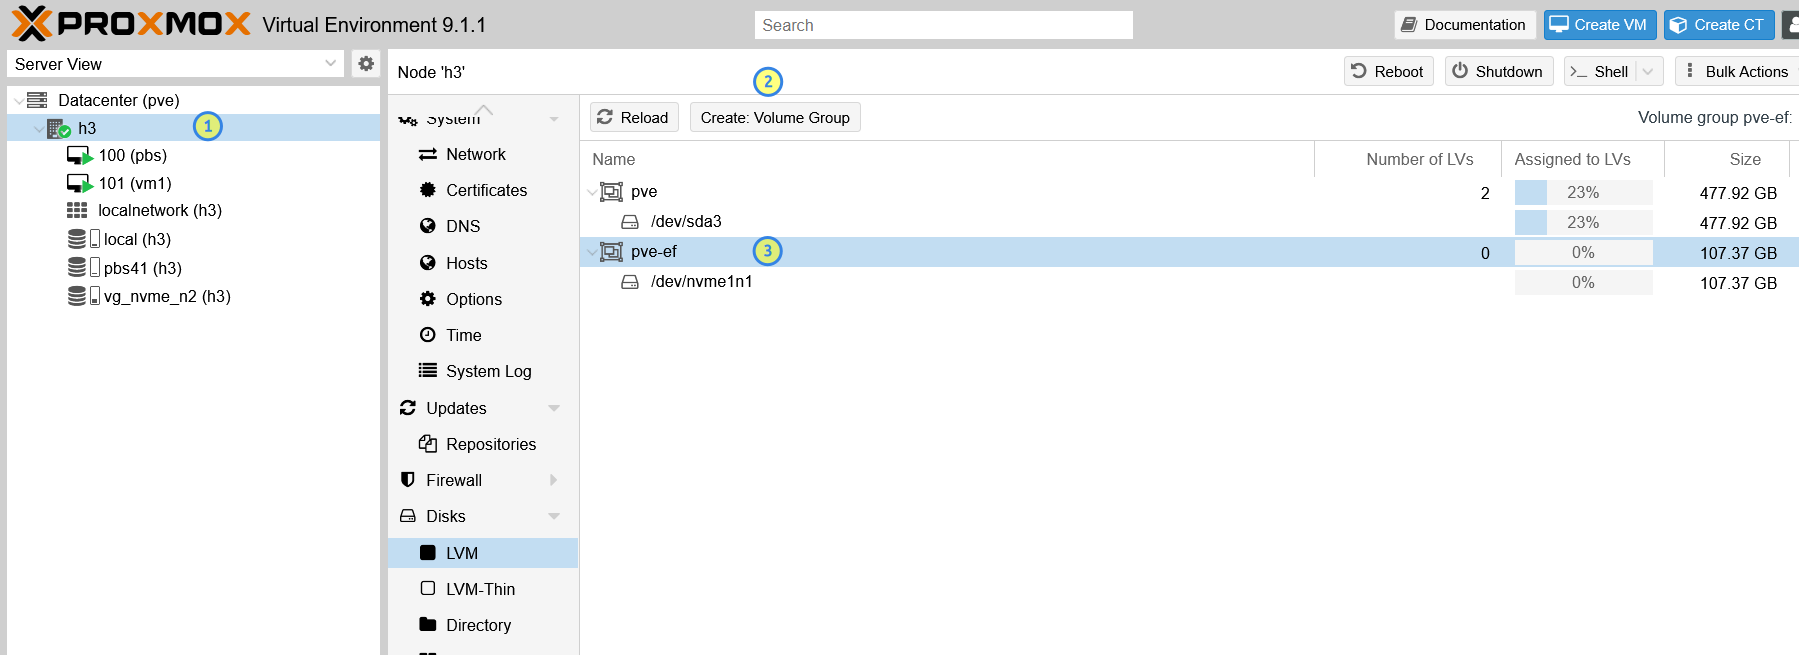
Now we need to create an LVM on this VG. Stay on the same host, move to Storage > LVM and add one.
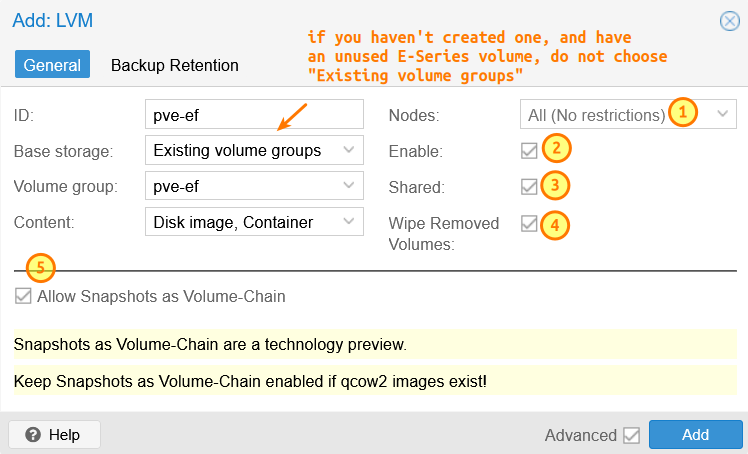
Because our VG exists, use "Existing volume groups". There are several options and all are recommended. Shared is the key one, because this LVM is going to be a shared block device. If you're building HA in pairs, you'd have several smaller pairs created on E-Series, and select the two Nodes that belong to a pair. Otherwise, leave that alone. Enable is obviously required, unless you want to do nothing with the volume, or want to do some preparatory work before "onlining" it. Wipe Removed Volumes is recommended because it's more secure (especially if you sometimes delete a VM and forget to delete its volume).
The last one, Allow snapshots as Volume-Chain (software snapshots), is also recommended, especially since hardware snapshots on SANtricity aren't that great. Just note that this feature is currently offered as a technology preview.
The next step is to create what's often termed a "cluster resource". Go to top level Datacenter menu and create a PVE cluster-level storage resource.
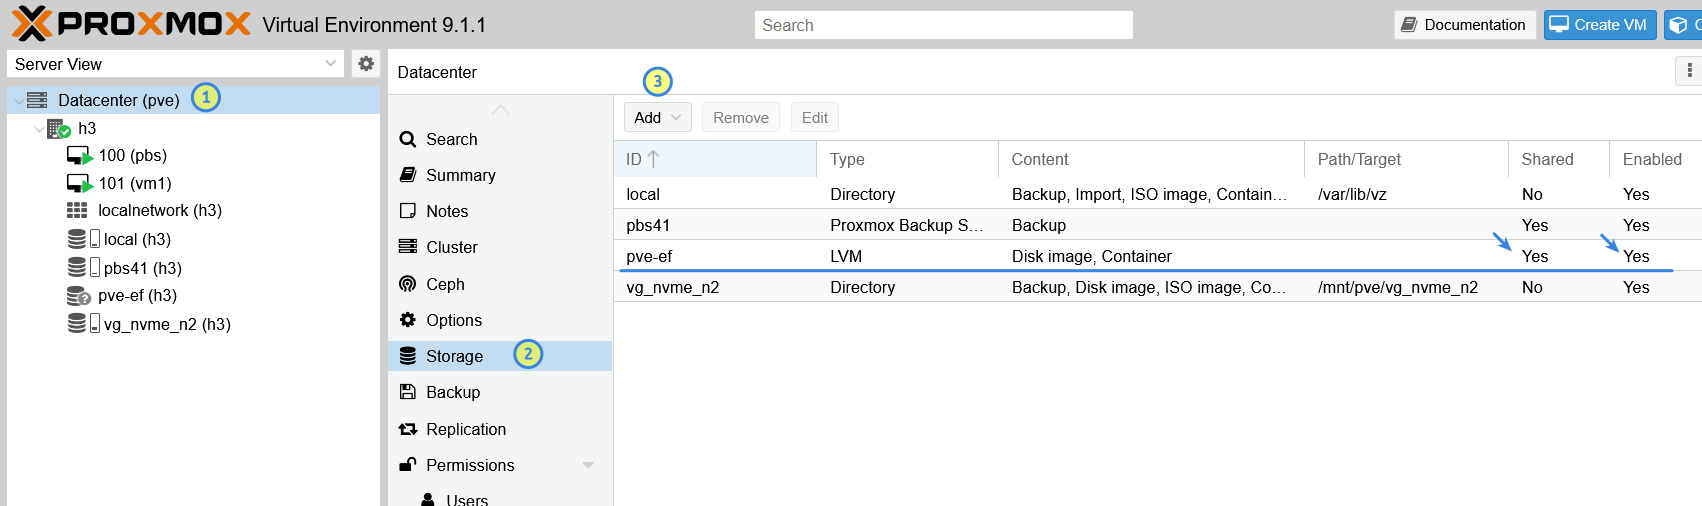
Now you may create a VM or LXC Container on this LVM. Or add more LVM devices of the same kind.
Make sure you pick the right storage (LVM you created) and among the non-default options, Discard is strongly recommended. You can include (or not) the disk in Backup plan for the VM. I did not include it because it is the first disk for OS and configuration files which I "push" from automation tools, so system volume backup is not required.
Note that the Cache item you see here is KVM-level cache, which isn't mirrored although there is an options to write-through and avoid having unprotected dirty cache on host.
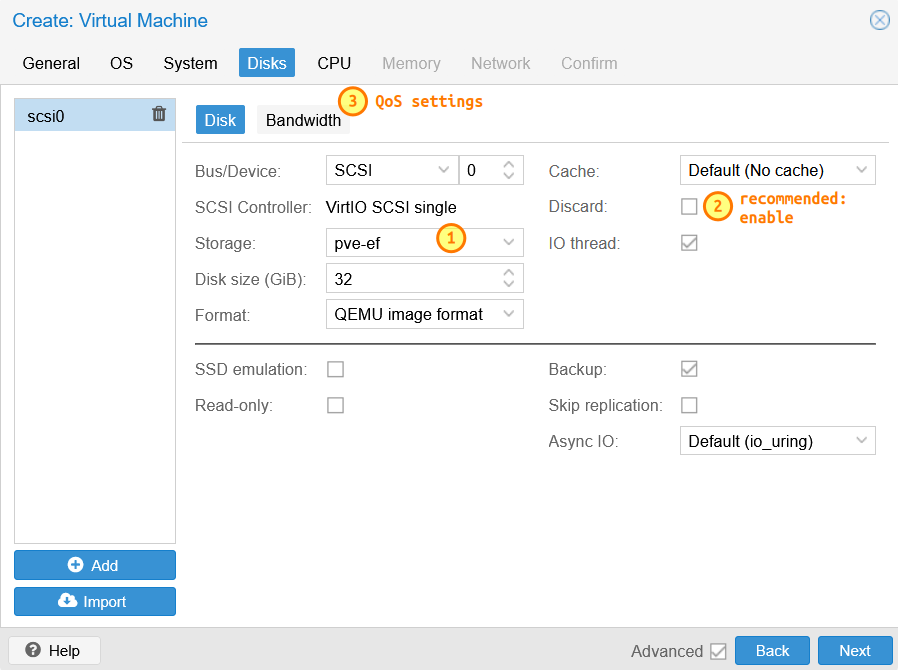
Don't miss the "Bandwidth" tab - the storage-limiting options are there. You can't guarantee "minimum" SLA, but you can limit VM from squeezing out other VMs or LXC containers.
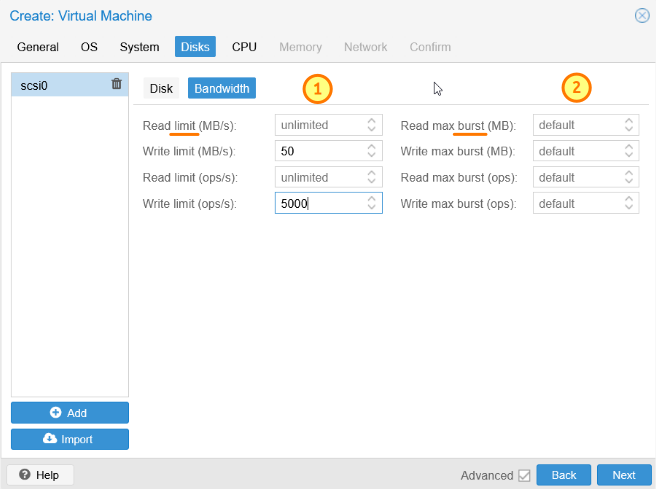
Ideas:
- On PVE with E-Series NL-SAS disks, you should probably limit IOPS on all VMs and set burst to the same limit. There must be scripts for this out there because it's such a basic idea
- On PVE with any storage, it's a good idea to set limits and burst values for all resources
- Monitor E-Series performance and fine-tune
LXC containers are no different, but the discard option is in a different place. It is strongly recommended.
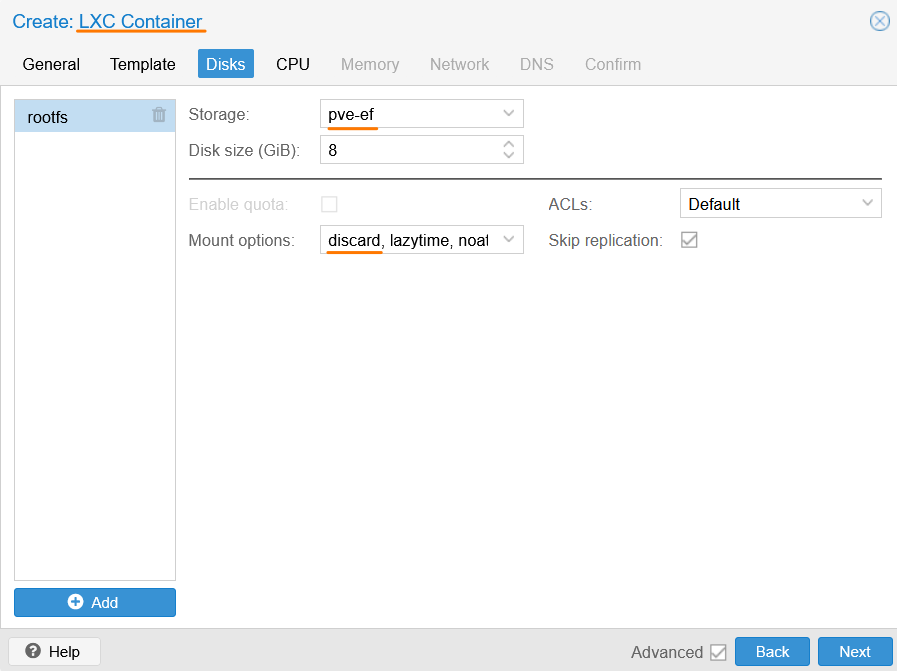
This way you can have a bunch of VMs on one shared LVM volume.
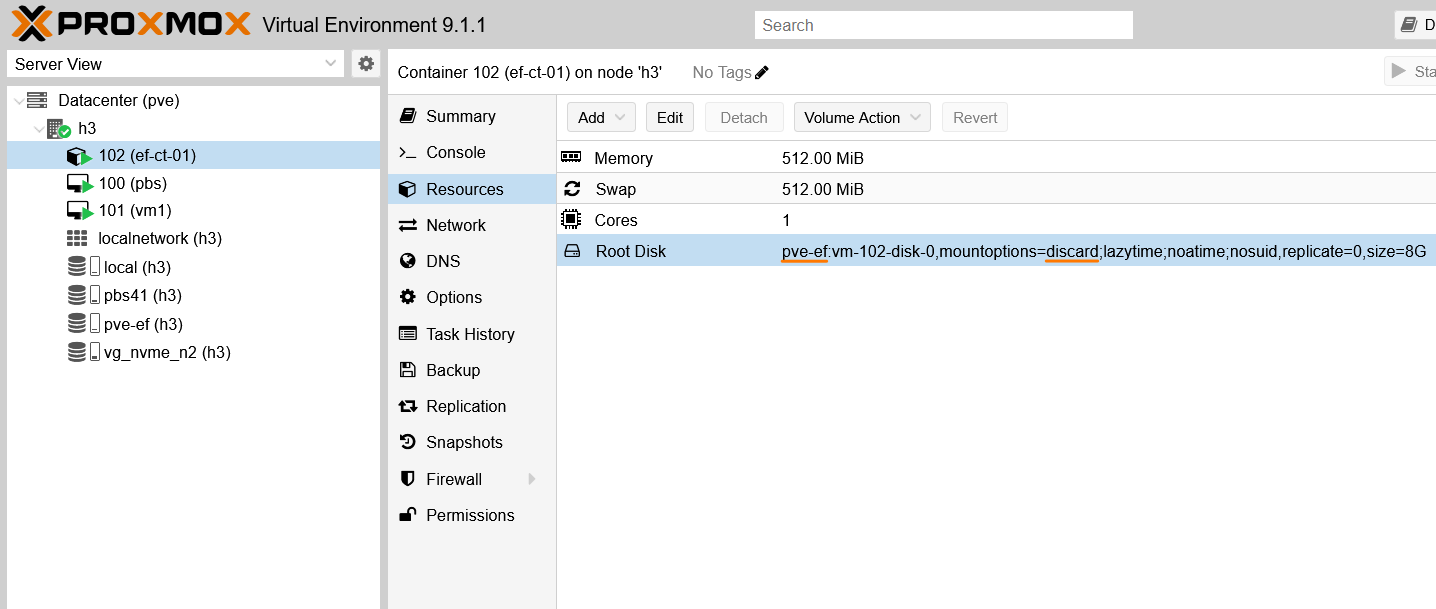
NOTE: The reason you see just an LXC container and not an LXC container and a VM is that the KVM shipped with Proxmox 9.1.1 had a bug which has been fixed since, but as a free-loading PVE user I can't get it. In 9.1.1 VMs can't be created on shared LVM storage without that fix.
LVM with Proxmox CLI
There are just two steps after hosts rescan and detect the volume: the first is to create a VG (on only one of the hosts).
$ pvesm status
Name              Type     Status     Total (KiB)      Used (KiB) Available (KiB)        %
local              dir     active        98497780         8579304        84868928    8.71%
pbs41              pbs     active        80280448         9103360        71177088   11.34%
pve-ef             lvm     active       104853504         8388608        96464896    8.00%
vg_nvme_n2         dir     active       114404832        27399440        87005392   23.95%
The second is to create an LVM on that VG, using the same host.
The Promox Storage Management CLI (pvesm) sucks and I lost patience figuring out how to create LVM with advanced options using pvesm.
Once that is done, /etc/pve/storage.cfg will show the LVM.
$ cat /etc/pve/storage.cfg
dir: local
        path /var/lib/vz
        content import,backup,iso,vztmpl

lvm: pve-ef
        vgname pve-ef
        content rootdir,images
        saferemove 1
        shared 1
        snapshot-as-volume-chain 1
The step with datacenter storage addition would come after that.
Verifying Proxmox PVE performance
Proxmox has this page with basic fio-based performance tests. As the page clearly states, those are very basic tests to get you started.
I generally dislike running these aimless tests unless I know what the objective is, but since the KB article is generic and I need a reference point, I followed the commands on the Proxmox Wiki page and did some extra runs to give you an idea of what might be relevant here.
Video walk-through
This video isn't a super-complete pro version of PVE benchmarking, but it covers the types of workloads commonly found in VM or Kubernetes environments.
While I repeated the same tests from the Proxmox Wiki, I also did a few more realistic runs. More realistic how?
- Filesystems (although this test is about storage, not filesystem, performance, you will have a filesystem on top)
- Write workload (50% write, which is excessive, but you might have that if you use 25% write on Btrfs or ZFS and use PVE to repelicate within same E-Series system)
- More realistic parameters in request sizes: 8 KiB for a "database-like" random workload and 4 MiB for "streaming-like" sequential workload
- More than one thread, more than minimal Queue Depth
- All E-Series tests done here use protected storage (that is to say, storage controllers, IO paths, and storage pools, and power supplies are all fully redundant). I highlight this from an availability perspective - and without trying to "compare performance" - because these tests include all overheads you may think of and the ones done by Proxmox maybe do not in which case you should consider how figures obtained from a 100% read test on a RAID 0 disk may translate to a 30% write workload after Erasure Coding or RF2 replication (including possibly 100% write amplification).
I also deliberately used bad settings for "minimally viable" EF600 performance (in this configuration):
- Apart from setting the storage NICs to MTU 9000 bytes, both the host and storage had zero tuning of any kind. All I wanted is to simulate a basic setup by someone who just followed steps in that NVMe post linked at the top.
- End-to-end disabled caching on the RAID 1 volume with XFS (totally unrealistic because it should really be enabled as E-Series by defaults mirrors its write cache and it's battery-backed and fully redundant). The RAID 6 volume had both enabled, but its results suffered due to Btrfs.
Highlights of EF600 tests:
- Slower performance for 4 KiB random read than in the simple test by Proxmox. Why? They likely used internal NVMe, which has no network latency and internal disks are especially beneficial for the tiny Queue Depth and the smallest request size possible, i.e. exactly what this test does. This is the worst kind of test for SANtricity. With simple, real-life modifications (e.g. 8 KiB requests and QD 4) SANtricity random performance takes off bigly.
- Faster SANtricity performance than the likely DAS in the Proxmox Wiki tests, when higher Queue Depths and more realistic request sizes are used
- Much faster performance with 1 MiB and 4 MiB "streaming" workload, due to more disks on E-Series
- Additional advantages of the SANtricity approach emerge when read percentage is not 100%, but there's no way to compare because the simple tests are limited to two workloads with a 100% read access pattern
Operational highlights:
- Both RAID 1 (it's RAID 10, but RAID 1 is E-Series configuration API) and RAID 6 volumes can be consolidated on DDP storage pools.
- For optimal price/performance, users would normally use RAID 1 for log-style workloads (e.g. PostgreSQL WAL log) and maybe write-heavy indexes and RAID 6 for the rest.
- XFS or ext4 should be used to set a baseline for understanding the impact of filesystem choice. Some, such as Btrfs, have distinct advantages, but also disadvantages compared to the bread-and-butter single host fileystems.
- There's relatively little one has to understand to make most out of E-Series performance. Tools like E-Series SANtricity Collector help you deep dive into performance, but in reality for most users on flash arrays, that is not necessary. If you use hybrid or NL-SAS, then you'll need enough disks to get decent random IO performance on NL-SAS - the same as on any storage system.
Other examples
These examples are not in the video, which would make the video too long, but illustrate some of the points made above.
Simple random workloads
This fio run with random IO uses 8 KiB requests (usually the minimum for databases) on a DDP storage pool-based RAID 6. The filesystem is Btrfs, we have a 30% write workload a minimal multi-threading and basic Queue Depth, to make it slightly more realistic.
$ fio --ioengine=libaio --direct=1 --sync=1 --rw=readwrite --rwmixwrite=30 \
   --bs=8K --numjobs=2 --iodepth=4 --runtime=60 --size 1G --time_based \
   --name seq_read --filename /mnt/btrfs1/fio-test
seq_read: (g=0): rw=rw, bs=(R) 8192B-8192B, (W) 8192B-8192B, (T) 8192B-8192B, ioengine=libaio, iodepth=4
...
fio-3.39
Starting 2 processes
Jobs: 2 (f=2): [M(2)][100.0%][r=11.9MiB/s,w=5333KiB/s][r=1520,w=666 IOPS][eta 00m:00s]
seq_read: (groupid=0, jobs=1): err= 0: pid=1092801: Sun Mar  1 04:12:28 2026
  read: IOPS=790, BW=6323KiB/s (6475kB/s)(371MiB/60003msec)
    slat (usec): min=7, max=555, avg=26.57, stdev= 7.34
    clat (usec): min=46, max=26642, avg=2646.35, stdev=2289.82
     lat (usec): min=61, max=26674, avg=2672.92, stdev=2289.97
    clat percentiles (usec):
     |  1.00th=[   72],  5.00th=[   86], 10.00th=[   88], 20.00th=[  124],
     | 30.00th=[  151], 40.00th=[ 2606], 50.00th=[ 2802], 60.00th=[ 2933],
     | 70.00th=[ 3097], 80.00th=[ 5342], 90.00th=[ 5932], 95.00th=[ 6259],
     | 99.00th=[ 8979], 99.50th=[ 9241], 99.90th=[ 9765], 99.95th=[10028],
     | 99.99th=[12518]
   bw (  KiB/s): min= 4544, max= 8512, per=50.28%, avg=6337.88, stdev=631.62, samples=119
   iops        : min=  568, max= 1064, avg=792.24, stdev=78.95, samples=119
  write: IOPS=338
...
Run status group 0 (all jobs):
   READ: bw=12.3MiB/s (12.9MB/s), 6281KiB/s-6323KiB/s (6432kB/s-6475kB/s), io=739MiB (774MB), run=60001-60003msec
  WRITE: bw=5415KiB/s (5545kB/s), 2708KiB/s-2708KiB/s (2773kB/s-2773kB/s), io=317MiB (333MB), run=60001-60003msec
1.1k (8 KiB) IOPS.
The performance is relatively poor for the reasons explained earlier. If I needed more performance, I'd use a filesystem suitable that kind of a workload (not Btrfs, for example) and, if I needed even more, I'd probably use RAID 1 volumes on the same DDP for the DB log file.
And I'd tune my storage and system (which I didn't do at all, as explained above and in the video).
All of these tests also test filesystem performance.
The Proxmox examples test block devices (which is technically correct for "storage" tests). I run these test with (on) filesystems because I don't need to demonstrate "best possible", but almost the worst, performance figures in part because of the fuzzy claims in the KB.
Let's see what happens when we make some improvements to both the filesystem and RAID level (XFS on RAID 1) while still using the same DDP storage pool.
$ fio --ioengine=libaio --direct=1 --sync=1 --rw=readwrite --rwmixwrite=30 \
  --bs=8K --numjobs=2 --iodepth=4 --runtime=60 --size 1G --time_based \
  --name seq_read --filename /mnt/ddpr1/fio-test
seq_read: (g=0): rw=rw, bs=(R) 8192B-8192B, (W) 8192B-8192B, (T) 8192B-8192B, ioengine=libaio, iodepth=4
  read: IOPS=10.6k, BW=83.0MiB/s (87.1MB/s)(4982MiB/60001msec)
    slat (usec): min=5, max=1693, avg=14.29, stdev=23.91
    clat (usec): min=20, max=2712, avg=136.74, stdev=56.32
     lat (usec): min=33, max=2724, avg=151.03, stdev=61.26
    clat percentiles (usec):
     |  1.00th=[   69],  5.00th=[   75], 10.00th=[   83], 20.00th=[  113],
     | 30.00th=[  119], 40.00th=[  124], 50.00th=[  131], 60.00th=[  137],
     | 70.00th=[  145], 80.00th=[  155], 90.00th=[  172], 95.00th=[  208],
     | 99.00th=[  355], 99.50th=[  400], 99.90th=[  603], 99.95th=[  807],
     | 99.99th=[ 1385]
   bw (  KiB/s): min=58016, max=92352, per=50.18%, avg=85107.09, stdev=4218.38, samples=119
   iops        : min= 7252, max=11544, avg=10638.39, stdev=527.30, samples=119
  write: IOPS=4560
...
fio-3.39
Starting 2 processes
Jobs: 2 (f=2): [M(2)][100.0%][r=170MiB/s,w=72.6MiB/s][r=21.7k,w=9298 IOPS][eta 00m:00s]
seq_read: (groupid=0, jobs=1): err= 0: pid=1093241: Sun Mar  1 04:14:46 2026
  read: IOPS=10.6k, BW=83.0MiB/s (87.1MB/s)(4982MiB/60001msec)

Disk stats (read/write):
  nvme1n2: ios=1269786/639560, sectors=20316576/9484696, merge=0/0, ticks=185087/244996, in_queue=430083, util=99.93%
From 1.1k to 15k IOPS. Almost 14x faster.
Based on prior work I'd guess 50-150% of the improvement is due to the RAID 6 to RAID 1 change, and the rest is due to the change from Btrfs to XFS. (Why Btrfs at all? Because it has good features that XFS doesn't, excels at SQLite, so there's no reason to reject it across the board for PVE workloads.)
Let's try the same run on XFS and RAID 1, but with numjobs=1 and iodepth=1, to align with the Proxmox random test, with the following exceptions:
- Use 8 KiB rather than 4 KiB IO requests to reflect modern database page sizes
- Use a 70% read rather than 100% read, as 10-40% write workloads are common
$ fio --ioengine=libaio --direct=1 --sync=1 --rw=readwrite --rwmixwrite=30 \
  --bs=8K --numjobs=1 --iodepth=1 --runtime=60 --size 1G --time_based \
  --name seq_read --filename /mnt/ddpr1/fio-test
seq_read: (g=0): rw=rw, bs=(R) 8192B-8192B, (W) 8192B-8192B, (T) 8192B-8192B, ioengine=libaio, iodepth=1
fio-3.39
Starting 1 process
Jobs: 1 (f=1): [M(1)][100.0%][r=23.8MiB/s,w=10.7MiB/s][r=3047,w=1369 IOPS][eta 00m:00s]
seq_read: (groupid=0, jobs=1): err= 0: pid=1093631: Sun Mar  1 04:17:03 2026
  read: IOPS=3100, BW=24.2MiB/s (25.4MB/s)(1453MiB/60001msec)
    slat (usec): min=9, max=556, avg=19.40, stdev= 3.82
    clat (usec): min=26, max=2242, avg=131.77, stdev=33.56
     lat (usec): min=86, max=2259, avg=151.17, stdev=33.89
    clat percentiles (usec):
     |  1.00th=[   79],  5.00th=[   81], 10.00th=[   86], 20.00th=[  119],
     | 30.00th=[  124], 40.00th=[  127], 50.00th=[  133], 60.00th=[  139],
     | 70.00th=[  145], 80.00th=[  153], 90.00th=[  161], 95.00th=[  172],
     | 99.00th=[  188], 99.50th=[  212], 99.90th=[  326], 99.95th=[  611],
     | 99.99th=[ 1188]
   bw (  KiB/s): min=23488, max=26160, per=100.00%, avg=24828.10, stdev=645.24, samples=119
   iops        : min= 2936, max= 3270, avg=3103.51, stdev=80.65, samples=119
  write: IOPS=1331, BW=10.4MiB/s (10.9MB/s)(624MiB/60001msec); 0 zone resets
...
Run status group 0 (all jobs):
   READ: bw=24.2MiB/s (25.4MB/s), 24.2MiB/s-24.2MiB/s (25.4MB/s-25.4MB/s), io=1453MiB (1524MB), run=60001-60001msec
  WRITE: bw=10.4MiB/s (10.9MB/s), 10.4MiB/s-10.4MiB/s (10.9MB/s-10.9MB/s), io=624MiB (655MB), run=60001-60001msec

Disk stats (read/write):
  nvme1n2: ios=185685/141282, sectors=2970960/1768400, merge=0/0, ticks=23835/22661, in_queue=46496, util=77.58%
The performance dropped from 15k to 4.4k IOPS, but that's fine: we need to remember we can't have a single thread IO workload and Queue Depth unless there's just one process using storage. This is a workload that doesn't exist on a virtualization host, and is very rare in VMs (of which you'll have several per host at the very least) as well.
Note that the PVE page gets 22k IOPS with a random workload, but that is with 4 KiB requests. Once you account for 20% write workload and need to protect it with RF2, you have a 40% write workload and those mirrored writes have to round-trip to another host just as they already do in E-Series systems, but not as efficiently.
Our second example above (15k in 8 KiB requests) achieves much better performance because we have 14 disks to write to and a non-ridiculous threads (2) and queue depth (4) make us waste less time waiting for IO due to there always being some in-flight IO requests.
It'd be nice to see XFS on RAID 6 (with controller cache enabled, as that's how everyone would use it in streaming workloads), but I don't want to spend even more time on this rather "academic" post that I wouldn't have written, given absence of any real-life problem associated with it.
Simple sequential workload
I won't share the sequential read examples to keep the post short, but all those performed very well and you may view them in the video. To cut the suspense, the same fio command with a 100% read workload on the RAID 6 volume with Btrfs resulted in 1 GiB/s.
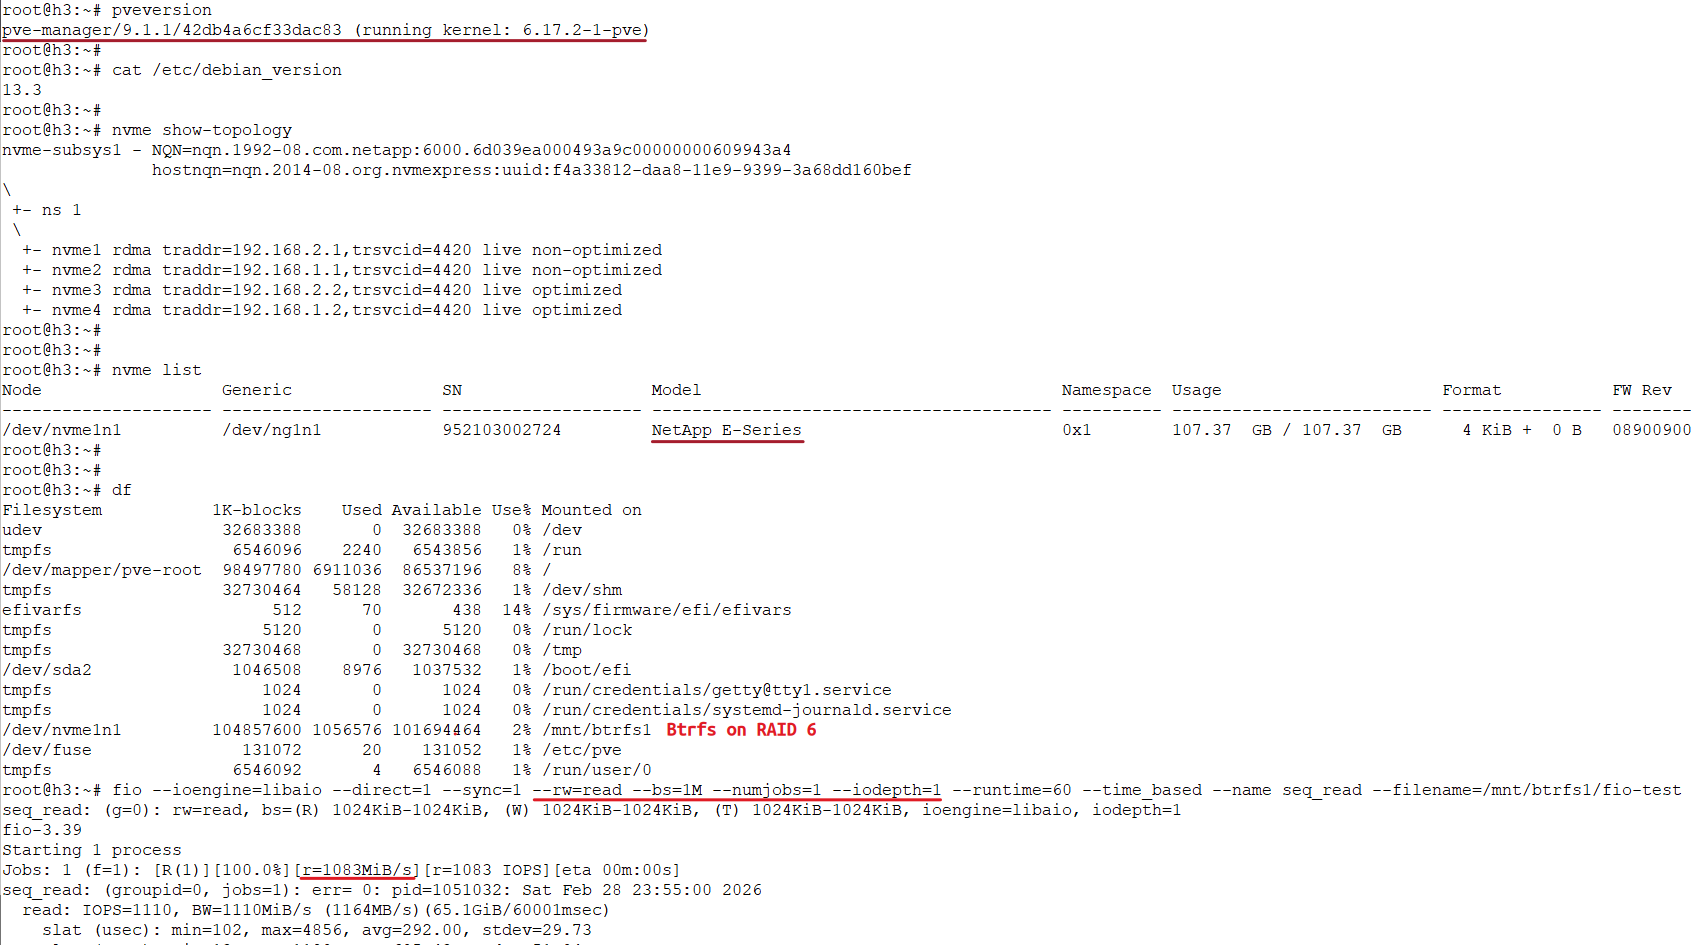
To get most out of reads you'd run them multi-threaded and - with E-Series - using a higher Queue Depth and larger request sizes (4 MiB, for example). So this is another example of a non-ideal workload - this time a sequential read - that still gets a decent result.
Summary
Not one of the tests - I ran about 10-15 variants - produced suspiciously sub-par results.
I encourage you to run the same tests with your storage system to compare (whether you want to disable storage caching is up to you, but disabling it on the client doesn't disable it end-to-end if the storage array has read and/or write cache).
Tuning PVE with E-Series
In the case you think "Okay, so this is almost worst, but how do I get the best, performance?"
This post isn't about that, but I'll add a few lines on that.
Check these official PVE performance tuning tweaks.
For the stack used in these (generic) tests, what we could do better:
- Tune storage NIC configuration (follow your NIC manufacturer's and distro's guides)
- Perform other OS-level settings (distribution-specific and Linux kernel guides)
- Enable read-write cache on E-Series (factory default: both are enabled)
- Create DDP volumes not just with workload-specific RAID levels, but also other volume options (such as cache block size). Note that RAID 1 on DDP must be created from the CLI or API (see the rest of this site or SMcli documentation) which SANtricity Go library (used by SANtricity CSI) can do. For detailed volume tuning options (which can be done out of band and after volume creation), your current options are the SANtricity UI and API, SMcli, my SANtricity client (Python client library), and my SANtricity PowerShell module
- Test several filesystem options (at least one of XFS or ext4, for reference)
- Test classic RAID storage pools. I recommend using DDP for everything rather than breaking storage down into islands, but in extreme cases you might want to try.
Demo video
A video that walks through the environment and shows how the tests were executed is available here.
Conclusion
Note that the KB refers to who-knows-what kind of storage configuration and host and network (mis)configuration. This post and the video demo show exactly what I did and how using PVE 9.1.1 with NVMe/RoCE storage on EF600 in absence of any tuning and even with some self-sabotage.
PVE with a slower array and NL-SAS will be slower, and if it's misconfigured it will be extremely slow. But that has nothing to do with Proxmox, Debian, iSCSI, NVMe/RoCE or E-Series. PVE (or Debian, or E-Series) are expected to perform exactly as designed and configured and not slower than other hosts or storage systems of similar configuration.
In theory, there may be a software-specific issue that makes PVE with E-Series slower than Red Hat with E-Series. In practice, everyone uses the same software stack (i.e. the Linux kernel, open-iscsi, NIC drivers…) and components and it never happens over extended periods of time. I've never encountered any issues, let alone those that persisted over many months.
But saying that Proxmox or Debian would be slower because they're not validated is almost equal to saying SANtricity is tuned for the validated Linux distributions or the validated distributions are tuned for SANtricity and Debian is not.
Despite wasting most of today on trivia, I've managed to expose the block_size parameter for volume resource in Terraform Provider for SANtricity. Sadly, nothing else got accomplished.