Proxmox PVE with NetApp E-Series-backed NFS/RDMA
Introduction
I've blogged about:
- PVE with E-Series arrays, with emphasis on NVMe/RoCE, but I also covered other protocols (iSCSI, mostly)
- Proxmox Backup Server backed by E-Series block with emphasis on NL-SAS disks
- Linked PVE clones from VM templates with NFS
The first, PVE-related post, commented on CephFS as a file-based alternative, but I thought to spend some time examining Linux NFS, as that should be an easy-to-manage, simple alternative for "cattle" VMs/containers.
Since most PVE users are familiar with Linux and NFS, I figured I just need to cover the "back-end" stuff - some notes on using E-Series block devices for NFS VMs, "rule-of-thumb" performance notes, design with E-Series and my setup and configuration steps.
I will focus on NFS/RDMA because the material about that with E-Series-backed block storage is virtually non-existent, so this post will close (most of) that gap.
NFS server configuration
Note that, in order to provide NFS/RDMA service out of a VM, you'd need the VM to have access to an RDMA NIC. Therefore for NFS/RDMA (not NFS/TCP) you need to either:
- Implement pass-through for a PVE-hosted VM with Linux NFS/RDMA for at least a pair of hosts that need RoCE capability
- It may also be possible (and easier) to RoCE available to guests by creating bridge on RoCE interfaces, but I'd have to un-configure and re-configure this cluster, so I'll leave this for another time
- Run NFS/RDMA on non-PVE servers, with "bare metal" access to RoCE NICs
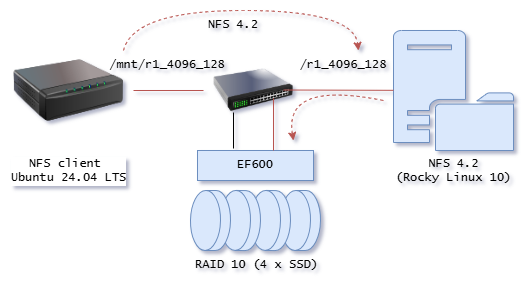
If you can't do either, then just fall back to regular Linux NFS service. There's also an ugly workaround for this situation explained later in this post. For this PoC, I used a bare metal server to run NFS/RDMA service in this initial PoC.
- Rocky Linux 10.1 (not a PVE VM!)
- Host name
h1 - Network
- Front-end 1 x 1GigE
- Back-end (storage and NFS) - 2 x 100Gbps (ConnectX-6) with MTU 9000, The NIC drivers came in Rocky Linux 10.1
- Storage
- NetApp EF600
- Volume group: 4 x SSD (RAID 10)
- Volume configuration: 4 x 10GB with read and write cache disabled. Two with 32KiB cache segment size, two with default 128KiB, two with 512e, two with default 4096 sector size. The default/standard volume (4K sector size, 128K RAID segment size) was used for NFS. Others were tested prior to that and due to the light workload a single NFS client can exercise, no significant difference was observed.
- NFS server options:
rdmaenabled- Default NFS configuration
- Exports:
/r1_<sector_size>_<cache_segment_size>(neither seemed to have major effect on single client performance) - NFS shares exposed and accessed on only one (192.168.1.11) of two NICs that are also used for NVMe/RoCE access to EF600 disk array
Configuration instructions for RDMA modules:
- my how-to for Rocky Linux 10.1
- the RHEL 10 documentation,
The NVMe/RoCE disks weren't even connected over multiple paths and I didn't try to remedy that because it wasn't necessary for this simple test.
$ nvme show-topology
nvme-subsys0 - NQN=nqn.1992-08.com.netapp:6000.6d039ea000493a9c00000000609943a4
               hostnqn=nqn.2014-08.org.nvmexpress:uuid:966595be-daab-11e9-a7bf-3a68dd15fe5f
\
 +- ns 1
 \
  +- nvme0 rdma traddr=192.168.1.1,trsvcid=4420 live optimized
 +- ns 10
 \
  +- nvme0 rdma traddr=192.168.1.1,trsvcid=4420 live non-optimized
 +- ns 11
 \
  +- nvme0 rdma traddr=192.168.1.1,trsvcid=4420 live optimized
 +- ns 2
 \
  +- nvme0 rdma traddr=192.168.1.1,trsvcid=4420 live non-optimized
 +- ns 3
 \
  +- nvme0 rdma traddr=192.168.1.1,trsvcid=4420 live optimized
 +- ns 4
 \
  +- nvme0 rdma traddr=192.168.1.1,trsvcid=4420 live optimized
 +- ns 5
 \
  +- nvme0 rdma traddr=192.168.1.1,trsvcid=4420 live optimized
 +- ns 6
 \
  +- nvme0 rdma traddr=192.168.1.1,trsvcid=4420 live optimized
NFS client configuration
- Ubuntu 24.04.3 LTS (PVE host with RoCE NICs can be used, as we shall see below)
- Host name
h2 - NFS client options:
-o rdma, mounting the four NFS exports:- The volume mounted at
/r1_4096_128 nfs4onh1shared over NFS/RDMA was mounted using the same network used by NFS server to access the block device that backed NFS share (not ideal, but also an example of a "worst case" scenario because only one link to storage was functional and the same was used for NFS/RDMA access).
- The volume mounted at
Configuration instructions for RDMA kernel modules:
- Don't forget to ensure that RDMA modules are loaded before network starts, as NFS mounts might fail without them
- my how-to for Proxmox 9.1
192.168.1.11:/r1_4096_128 /mnt/r1_4096_128 nfs4 rw,relatime,vers=4.2,rsize=1048576,wsize=1048576,namlen=255,hard,proto=rdma,port=20049,timeo=600,retrans=2,sec=sys,clientaddr=192.168.1.12,local_lock=none,addr=192.168.1.11 0 0
fio tests
Single client accessed NFS share h1:/mnt/r1_4096_128 and ran write workloads looping over all of the following parameters:
- Request size (KiB): 4, 8, 128
- Threads: 1, 2, 4
- Queue depth: 1, 2, 4
fioparameter highlights:--direct=1 --fdatasync=1 -readwrite=write(100% non-cached writes)
$ fio --randrepeat=1 --ioengine=libaio --direct=1 --gtod_reduce=1 --name=test  \
  --bs=${BS}k --iodepth=${QD} --size=1G --readwrite=write --directory=${MNT} \
  --numjobs=${THRD} --fdatasync=1 --runtime=30 --time_based --group_reporting
Test, results, observations
Note that I used a 100% non-cached write workload on protected storage and two over fabric hops (from NFS/RDMA client to NFS/RDMA server, and from the NFS server to NVMe/RoCE block storage on E-Series).
The Proxmox Wiki fio test commands used 100% read, likely on internal NVMe disks (no protection, absoutely trivial workload, no round-tripping that it'd need for protection, no delays due to round-trippping and processing by other hosts). As I explained in the performance post, they didn't claim it was any different, I'm just adding context for your awareness.
100% write tests aren't representative of real-life workloads. A 70/30 read-write breakdown would be closer to what one might expect in a PVE environment with disk array-protected storage. The only semi-exception is the PBS (Proxmox Backup Server) workload which would be close to 100% write with 128K requests.
Minimal (4KiB, QD 1, single thread)
| Test | IOPS | Comment |
|---|---|---|
| Proxmox internal | 22,800 | Trivial test with 100% read, likely single disk |
| NVMe/RoCE block | 7,100 | Trivial test over fabric. 100% read, multiple disks |
| NFS/RDMA file (on NVMe/RoCE block) | 2,130 | Trivial test over NFS/RoCE backed by NVMe/RoCE |
The same comment from NVMe/RoCE post applies:
- you'll never have this kind of workload in a PVE environment
- with just 3 VI servers, each running 1 active VM/CT, you'll have 3 such workloads. Also extremely unlikely.
- 8K, not 4K, is probably dominant IO request size these days
The two "over-fabric" (oF) tests were comparatively slower due to round-tripping over fabric.
Unless your application makes copies, you'd have to round-trip with unprotected internal disks as well, your workload would get much worse with internal disks (from 100% read to a likely 30%, amplified to 40%-60% write). This is another reason why this simple test isn't meaningful.
Realistic VI (8KiB, 70/30 r/w, VMs/CTs)
These are more interesting:
- VI environment with 100 VMs/LXD containers per host (say, 300 VMs)
- Assume 70/30% read-write ratio on protected storage volumes
- Assume 70% are idle, 20% doing 50 IOPS, 10% busy (500 IOPS x 8 KB)
- Total: 60 VMs x 50 + 30 VMs x 500 = 3,000 + 15,000 = 20,000 IOPS (70/30 read-write)
- Threads: assume 0.2 per active VM, so 50 + 30 = 80 x 0.2 = 20 QD
- Queue depth: assume 1 per active VM
On queue depth: because most VMs' queues will be empty. We know that because - see the test with BS=8, THRD-1, QD=1 in Appendix A - we get 1,948 IOPS with QD 1, so 500 IOPS will have average queue depth of ~0.25 and lower IOPS will mean even less.
| Test | IOPS | % Read | Disks | Req Size | Queue Depth | Threads | Comment |
|---|---|---|---|---|---|---|---|
| Proxmox internal | 22,800 | 100% | 1 | 4 | 1 | 1 | Trivial test with 4K requests and 100% read (for reference). 1 disk (guess) |
| NFS/RDMA | 17,100 | 0% | 4 | 4 | 4 | 4 | Sufficient for assumed workload but with 4K requests, IOPS-wise |
| NFS/RDMA | 19,000 | 0% | 4 | 8 | 4 | 4 | Sufficient for assumed workload with 8K requests, IOPS-wise |
I don't "convert" these 100% write results to values expected for 70/30 read (probably 1.5x more at scale) because at this scale, queue depth and IO sizes are the limiting factor, and 100% write is not.
Roughly speaking, a single VM would suffice for all of the workloads from that scenario above.
Personally, I'd run all the busy ones on LVM/NVMe/RoCE, so what's left would run just fine in a regular Proxmox VM with non-RDMA NFS service. The main thing you want to solve is storage (E-Series takes care of that) and availability (more on that below).
Realistic Analytics (128KiB, 50/50 r/w)
The sequential fio test from Proxmox Wiki uses BS=1MiB, THRD=1, QD=1 and gets 157 MB/s.
I ran the same tests with 1MiB and 4MiB in the NVMe/RoCE post, but - as I explained there - it wasn't comparable because I had more disks in E-Series and Proxmox likely had one. Sequential is where even SSD count matters, so these aren't comparable.
Secondly, you are much more likely to run several workloads with 128K request sizes and heavy writes, rather than one with 1M, 100% read requests and the queue depth of just 1:
- Most NOSQL and queue/messaging (Kafka, Elasticsearch…) - maybe more than 50% write (with RF2 on application)
- Proxmox Backup Server - you may have just one, but it will be very busy for several hours every day, doing 100% write during that time. See this post on PBS
Now, I don't recommend using NFS for either of these workloads (use NVMe/RoCE or iSCSI with RF2 on application level), but in terms of heavy workloads that's what users would have - not read-only with 1M.
| Test | % Read | Req Sz | MB/s | Queue Depth | Threads | Comment |
|---|---|---|---|---|---|---|
| Proxmox | 100% | 1,024K | 157 | 1 | 1 | Trivial and unrealistic read test, 100% read, likely on 1 internal disk (for reference) |
| NVMe/RoCE | 0% | 1,024K | 1,377 | 1 | 1 | Trivial test, but more physical disks. 1MiB requests. 100% write |
| NFS/RDMA | 0% | 128K | 1,489 | 4 | 4 | Smaller request size, bigger QD and more threads. 100% write |
A 100% write test with NFS/RDMA was probably close to getting limited by the RAID 10 volume group with only 4 disks.
A 100% read workload would likely work slightly better considering the small R10 VG size, but I didn't want to run these tests because it's tricky to fully eliminate the effects of read caching on NFS server and client (I'd have to create a 500G volume and fill it up completely to be sure, which is time consuming).
This 100% write workload shows a worst case scenario, write cache was disabled, and it still ran well. The fio result corresponded to what I saw in SANtricty UI.
The NFS/RDMA was slightly faster than NFS/RoCE, which doesn't seem logical, but the read test on NVMe/RoCE used just one thread and QD=1 (I got 3+ GB/s when these were increased).
E-Series models deliver up to several - in some cases many - GB/s in sequential performance, and RAID 6 on DDP is recommended for them. Use NL-SAS for predominantly read with requests above 1MiB and SSDs for high write percentage with smaller requests (such as 64-128 kilobytes) if you need high performance. For more, see my posts on Elasticsearch or MinIO, for example. Databases and messaging doesn't work that great on NFS, so I do recommend NVMe/RoCE or iSCSI over NFS for that.
How to do NFS with E-Series
First, do you need NFS? It adds overhead, both management-wise and maybe slightly less in terms of IO (especially with NFS/RDMA). See the post about the various storage options for PVE for block-related choices. In my opinion, Linux NFS is suitable for a bunch of small containers and VMs, if you have hundreds of those and don't want to create 32 LVMs on 32 LUNs on E-Series to host 1,000 small, non-critical CTs (32 per LVM). (You'd still need at least 4-8 NFS VMs, rather than 1 huge VM, for NFS to host 1,024 CTs.)
Secondly, if you need NFS in a PVE environment, what do you need it for? If it's just to store a bunch of "cattle" workloads and you have a Proxmox Backup Server, you probably don't need any NFS "features" except HA and performance (which seems OK here), so we can proceed.
Next, High Availability. Block storage that backs NFS is taken care of (it's protected and redundant), but we need at least basic (meaning, a short disruption such as a restart of NFS-hosted CTs, when unplanned failure happens) HA. Approaches:
- Simple PVE-based HA setup: VM with NFS, with HA provided by PVE. If the case of unplanned failover, this VM would have to come up before workloads that use it, so prioritize it. Also, it would not be entirely disruptive, but that's probably okay for "cattle" workloads.
- An HA sever pair with HA provided by CoroSync and Pacemaker (standard Linux HA for bare metal) or a two-node PVE cluster dedicated to NFS (PVE uses the same approach to HA). As this is more expensive, it's justified if you have more important workloads, or many, on NFS. With two or more NFS shares, you can run Active-Active on the HA/PVE-NFS cluster, and also run PBS on the same cluster. That way you isolate both NFS and PBS from compute workloads, and can still segregate PBS from NFS in terms of network, compute and storage (use different volumes or even storage pools) resources.
In both of these approaches, make sure PVE does not rely on NFS for critical services. Use block for those, so that if NFS completely fails, your PVE and PBS are still available for use. Do not use NFS for PBS data stores either, since there's no advantage to that and it can be another circular dependency. That's why I do not recommend running NFS and PBS inside of the same cluster where VM/CT workloads run.
Regarding deployment options, this is how not to do it:
- Single NFS (bare metal) server - no server redundancy
- Same non-redundant link for NFS/RDMA service and NVMe/RoCE
A nicer option is a pair of physical servers in own PVE cluster. You can co-locate PBS and NFS in this cluster, and have multiple NFS VMs. Then you rely on PVE for HA for both NFS and PBS VM.
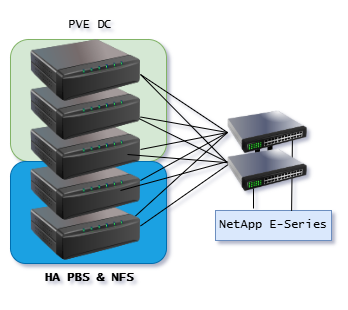
Unlike in the other PVE post where I mentioned how we can avoid storage switches with 2-4 PVE servers, here we have 5 servers, so unless we cut corners and used a single link to storage from the PBS/NFS cluster (which would keep iSCSI port count down to 8 iSCSI ports on EF300 and EF600), we'd probably have slightly more failures without redundancy, but they'd be limited to fail-overs of PBS and NFS VMs, which may or may not be tolerable. For NVMe/RoCE and NVMe/RDMA, switchless design with several PVE servers would not be possible due to not enough NVMe ports in the existing E-Series models.
Workaround for lack of NFS/RDMA on VM on PVE servers
Related to the note from the top, about RoCE NIC access to Linux NFS/RDMA VM: if you can't get it done and want to force the issue, you could - I suggest not to - try this approach:
- Run Proxmox or Ubuntu as bare metal KVM host with nested PVE (for PBS, for example) and use PVE cluster to provide HA for PBS
- Run NFS/RDMA service directly on bare metal host, with Corosync/Pacemaker for NFS (Active-Standby)
- All but 2-4 vCPUs can be allocated to PVE; leave 2-4 for NFS/RDMA
This isn't great, but if you can't do pass-through and "insist", this should work fine, especially since this 2-node nested PVE should be a stand-alone PVE cluster in the first place (not part of the PVE cluster which it's meant to protect).
I haven't tried this myself as I couldn't make changes on the system I had, but enabling IOMMU in BIOS and kernel allowed me to surface devices to guest VMs.
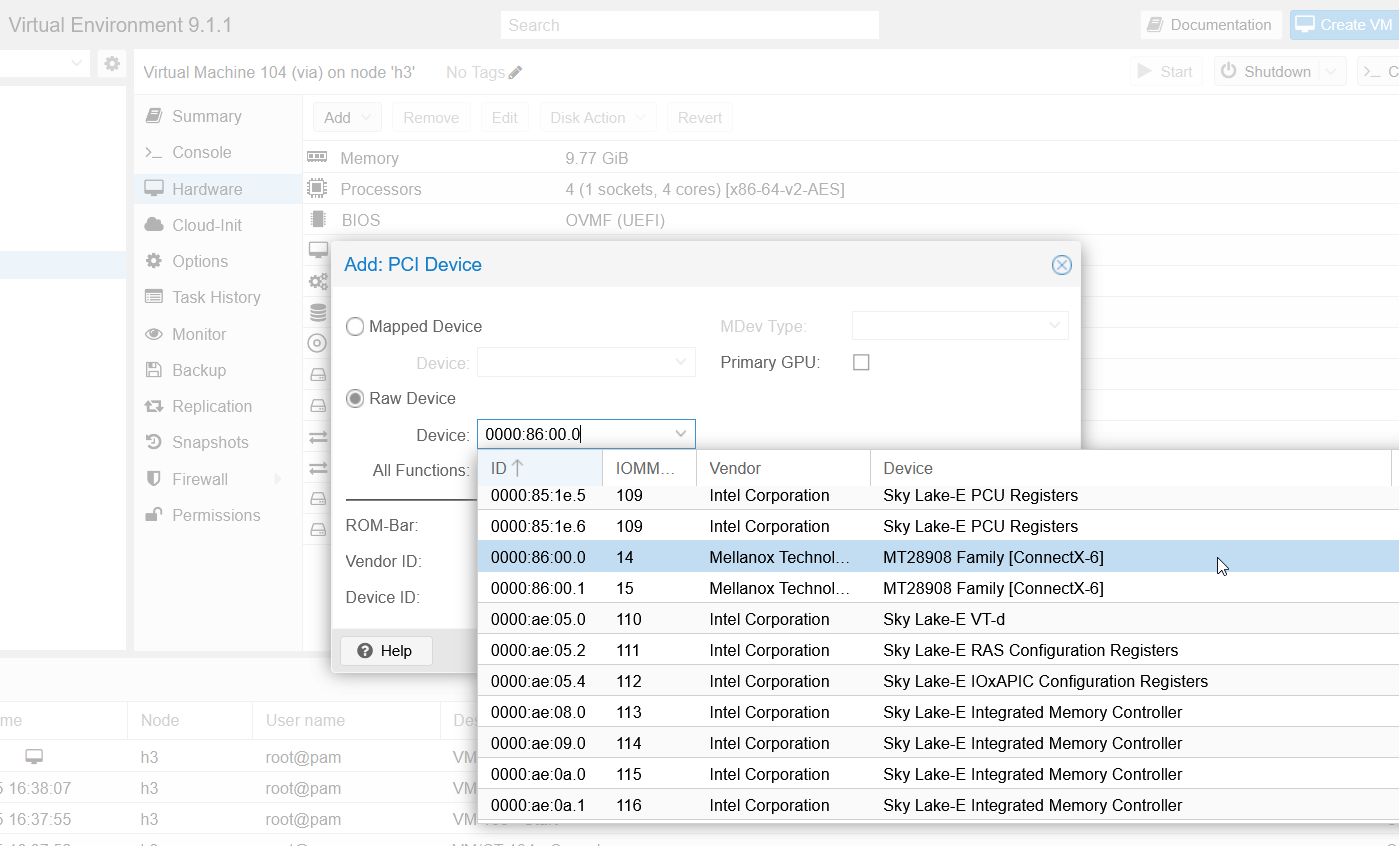
After this, a VM "sees" the Mellanox NICs:
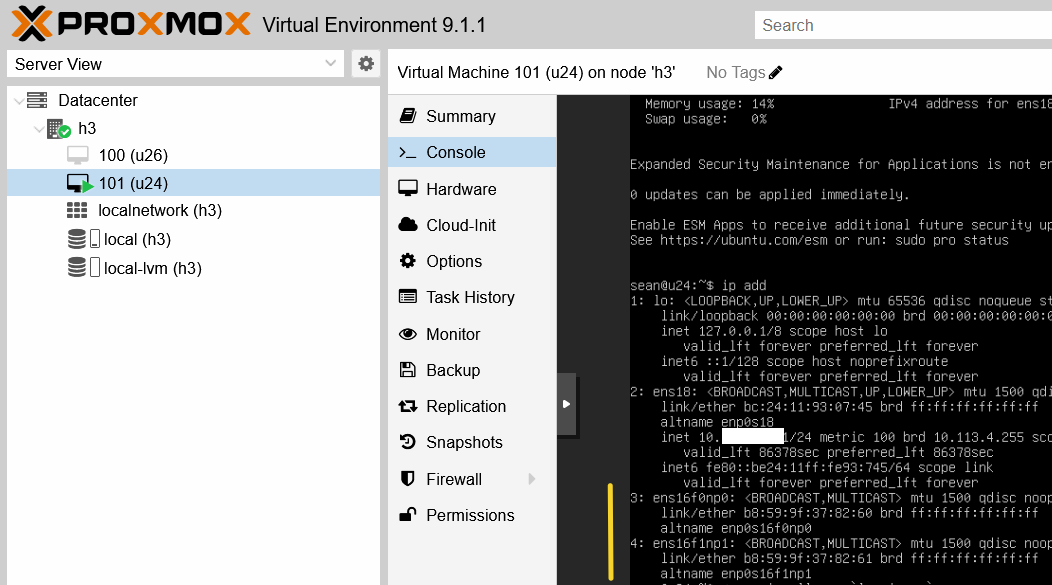
An issue with this approach is that it takes the NIC from the host, so this won't work for both guest and host without a separate RoCE NIC for NVMe/RoE assigned to the PVE host. Also noteworthy is that although Mellanox appears twice, when just one PCI device was passed through, both were given to the guest (this may be a dual-ported ConnectX-6).
Network (RoCE)
NVMe/RoCE is currently available on EF300 and EF600.
Which array to choose:
- EF300 is probably the best model for up to 500 VMs (say, 200 "pet" VMs on 12 LVM/block devices and 300 "cattle" VMs/CTs across two NFS shares). NVMe/RoCE is available, as is iSCSI.
- E4012 or E4060 for NL-SAS-focused NFS service (lots of idle VMs, sequential workloads, and/or a large PBS portion) with optional SAS SSDs if required. But it has no NVMe/ROCE and no NVMe SSDs at this time, just iSCSI and SAS SSDs, so NFS/RDMA on hosts/clients doesn't make much sense (use NFS/TCP).
- EF600 for large environments (>1,000 VMs/CTs) with NFS, but in this case you may be better off with E-Series-backed CephFS. NVMe/RoCE is available.
At EF600 scale, CephFS may be easier to manage than many smaller NFS VMs. But if you prefer smaller failure domains (e.g. one HA NFS server per department), there's nothing wrong with Linux NFS, with or without RDMA.
I wouldn't recommend either Linux or CephFS over ONTAP for environments where NFS is critical or need complex features.
Proxmox PVE as NFS client with NFS/RDMA server
Non-RDMA NFS users can ignore RDMA and use NFS/TCP as usual.
NFS/RDMA users on 9.1.1 will notice the UI won't let you specify NFS scan options, so "-o rdma" isn't available and without that option, nothing gets discovered. The CLI (pvesm scan) won't let you do that either (and it doesn't do it automatically even if the rdma modules are already loaded).
Approaches:
- (semi-hack): PVE storage configuration file, and add "
-o rdma" to NFS mount options. I didn't like that, so I didn't want to try. - (semi-hack): add your NFS mount(s) to
/etc/fstabon all PVE hosts to mount NFS share(s) upon OS boot and add these NFS mount points asDirectorytype storage with theSharedoption checked. I used this in my testing. It seems safer, easier and cleaner. - (safe): give up on NFS/RDMA until Proxmox fixes their UI and
pvesm(CLI), flip to NFS/RDMA after it becomes available
"Full allocation" would be a good idea to not accidentally run out of space, but the same applies to block storage. Remember to enable Discard on your Linux NFS server in that case, to keep discared junk and empty space away from backend block device.
My NFS/RDMA data store in PVE 9.1.1:
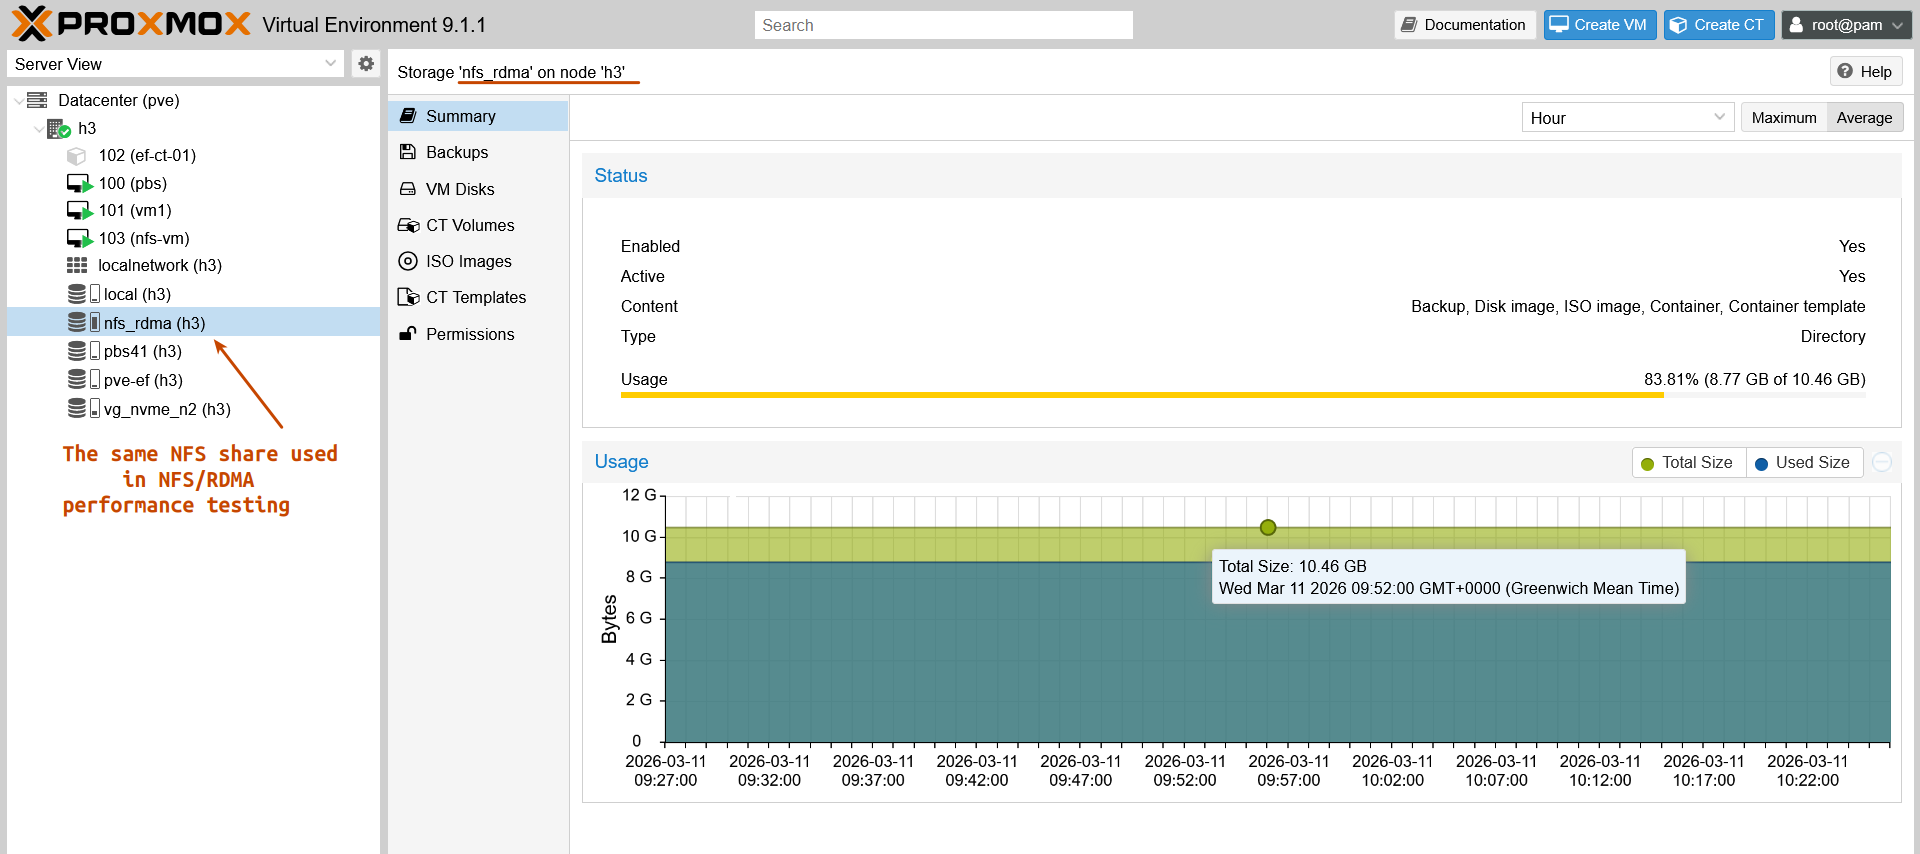
Again, I did not add it as NFS/TCP (this would have worked without workarounds). I added it as NFS/RDMA, but using my preferred hack-ish approach explained just above: add a Directory-type data store on all PVE hosts that need access, with the Shared property enabled.
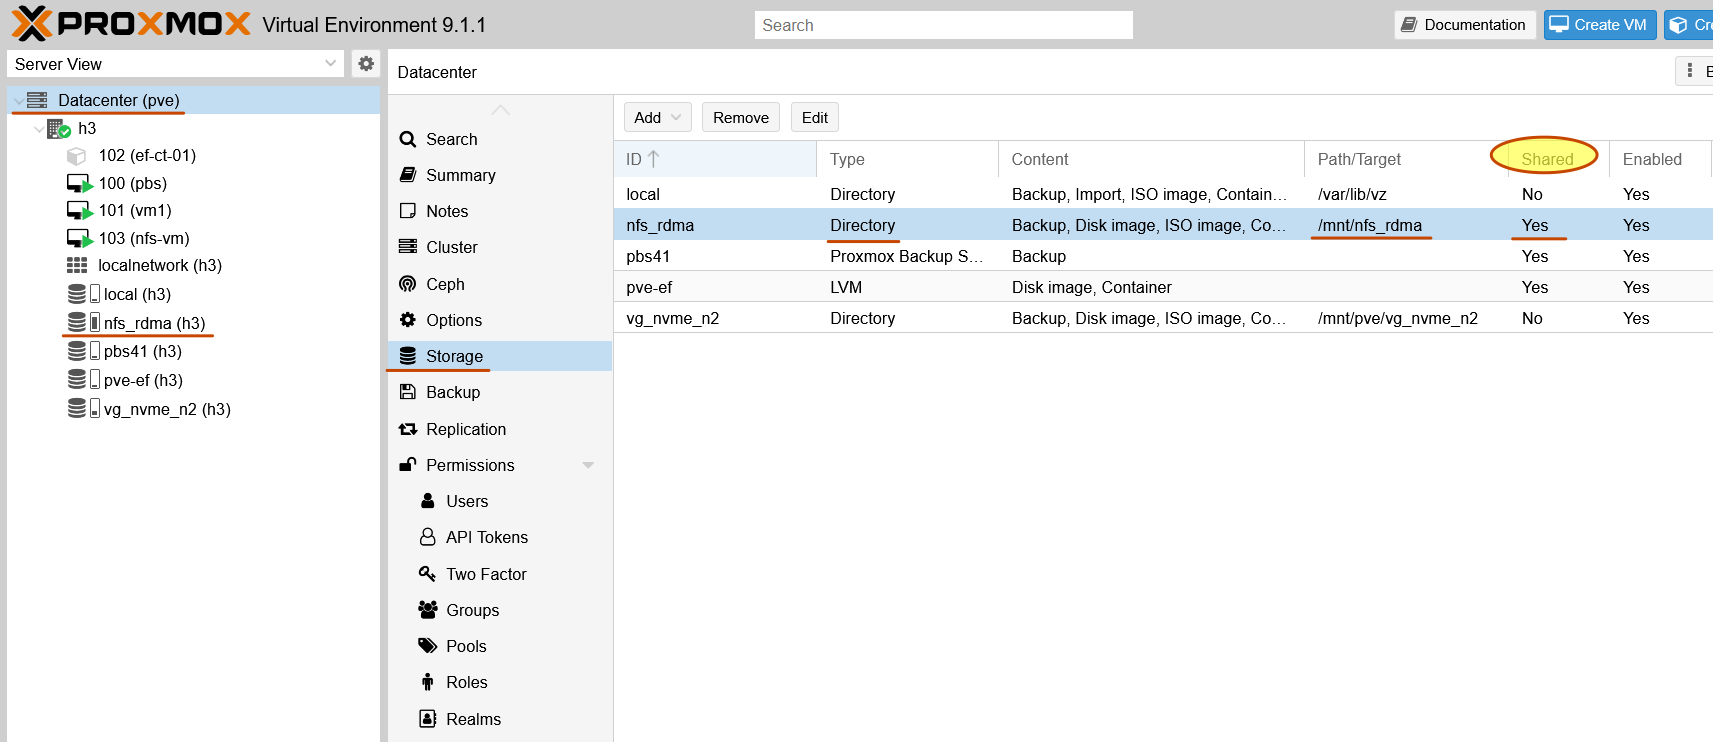
NOTE: you do need to load rdma modules before you attempt to mount NFS. Test-reboot a PVE node to see that RDMA is loaded before network is available and NFS mount attempted. Add your NFS options to /etc/fstab as you use them:
192.168.1.11:/mnt/r1_4096_128 /mnt/nfs_rdma nfs rdma,rw,bg,hard 0 0
My PVE storage configuration for this NFS/RDMA share:
dir: nfs_rdma
        path /mnt/nfs_rdma
        content vztmpl,iso,rootdir,images,backup
        max-protected-backups 4
        preallocation falloc
        prune-backups keep-all=1
        shared 1
        snapshot-as-volume-chain 1
Non-RDMA users will simply have no issues adding NFS - there's no need for any workarounds.
Backup and restore
Backup and restore of Linux NFS VM
If you run NFS on E-Series-backed block devices (LVM on block), PBS can back them up (and restore) without issues.
If you have one NFS VM per LVM - co-mingling with other NFS VMs, PBS or compute VMs isn't suggested - you may also schedule E-Series snapshots (say, 1 every 8 hours, keep 3) for emergencies:
- This allows you to recover to a point-in-time between PBS backups, although PBS backups would be preferred.
- Recovery from E-Series "hardware" snapshots would have to be handled as usual: shut down the NFS VM and all its clients, unmount the LUN from PVE, restore the snapshot, mount the volume, start NFS VM, start NFS client workloads. Unnecessary to say, this is annoying and disruptive, but it's meant for emergencies if a PVE local snapshot gets destroyed, or a PBS-backed snapshot fails to restore. Note that we can create "consistent" snapshots by freezing NFS VM seconds before, and unfreezing it seconds after, the h/w snapshot - just make sure NTP servers are working correctly for PVE and E-Series. In the worst case you'll still get the usual crash-consistent snapshots. You can use my Python and PowerShell clients for SANtricity to execute scripted snapshots on SANtricity (see the blog for more).
Do not place an NFS VMs disks on different type of media (e.g. NL-SAS, SSD) if you want to get consistent hardware snapshots, since those disks would belong to different storage pools or maybe different arrays.
Note that PBS provides both snapshots and file-based recovery, so VMs or CTs could be recovered from a "local" PVE snapshot easier and faster. This is more aligned with PVE's way of doing things, so E-Series snapshots would be used to recover only in extreme cases (i.e. ransomware or catastrophic human error on PVE). You'd need to "reserve" some "snapshot repository" capacity on E-Series for that. For example, reserve 10% of LUN size if you keep 3-4 snapshots for 24 hours; 10% should be enough if rate change is less than 10% per day.
Backup and restore VM/CT located on NFS data store
I also tested this, just to see if there's anything unusual - there was nothing, it worked really well.
These charts show IOPS and MB/s for:
- Host name
h3(PVE 9.1.1 stand-alone cluster) - Installation of Ubuntu 26.04 LTS on NFS data store
- Backup and restore of NFS-based Ubuntu 26.04 LTS
Measured in IOPS, random IO is prevalent during OS installation and update. It is highest during OS restore, because it's a large read without any CPU or OS activity (such as the processing of package updates) on the VM.
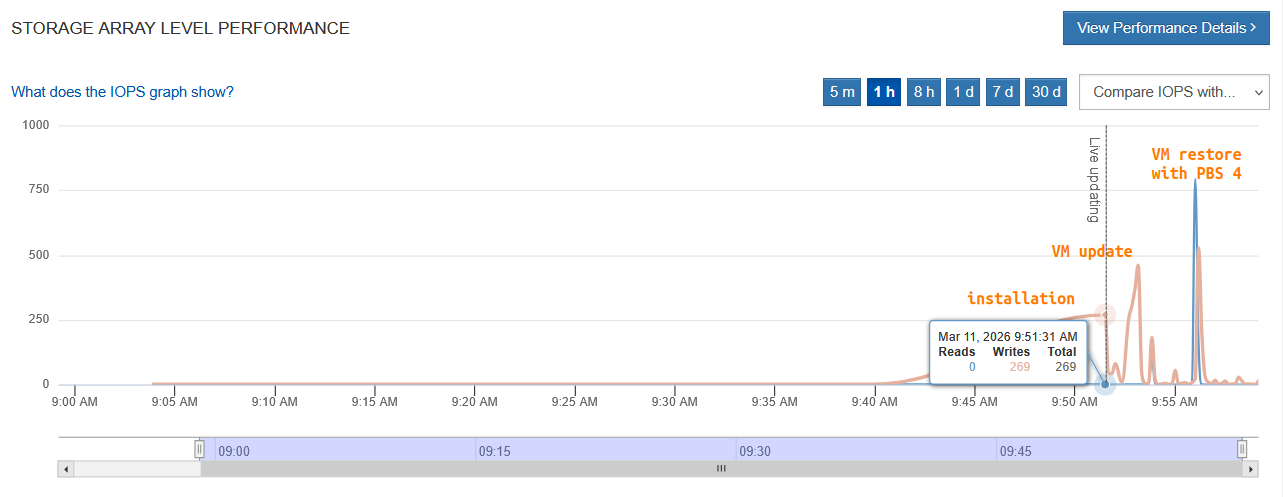
In MB/s, those 600/700 MB/s in read and write:
- 700 MB/s is read, coming from PBS server on NVMe/RoCE
- 600 MB/s is write, showing restore writes to NFS (incidentally, backed by the same volume group on E-Series), and almost hitting the FIO benchmark performance for 128KB 100% writes obtained in non-PVE client testing above
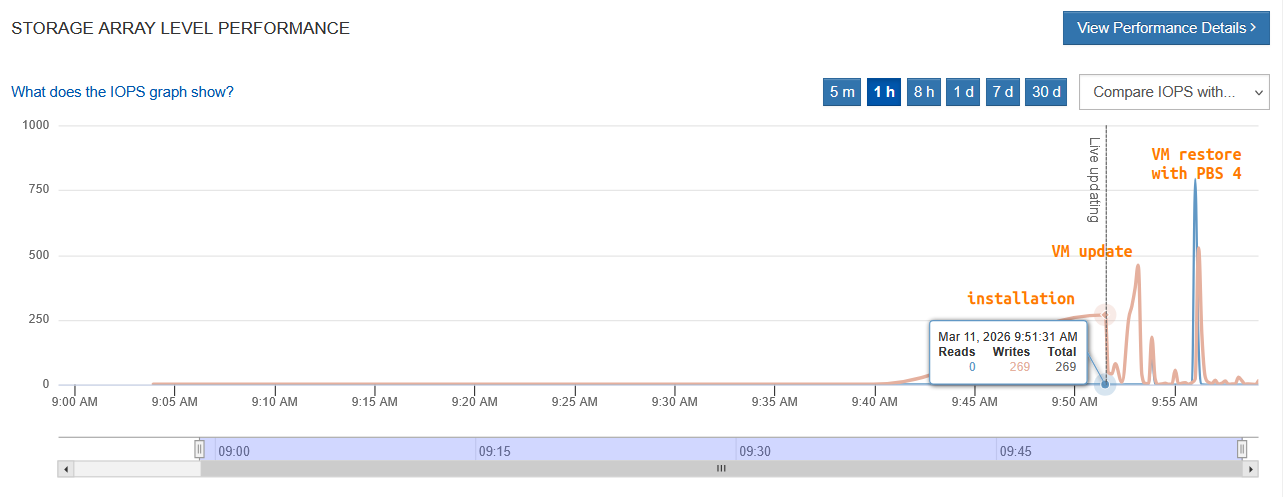
It seems we almost max out Proxmox backup client's performance (rated at 775 MB/s on Ryzen 7 2600X) using CPUs on the (very old) h3 uniprocessor server I was using. This is good to know because now you also know 1 GB/s per PVE host is roughly most one can get when backing up.
Backup and restore logs are available in Appendix B below.
Remember to enable Discard for Linux NFS server, whichever filesystem it uses, otherwise it'll constantly grow and bloat backend LVM capacity up to 100% of allocation (data disk size) which could be expensive with SSDs.
One final note. From TFM:
After an NFS request times out, NFS request are retried indefinitely by default. This can lead to unexpected hangs on the client side. For read-only content, it is worth to consider the NFS soft option, which limits the number of retries to three.
- You might have exactly that kind of workloads - read-only content (static Web sites, front-end apps) - on NFS (at least I would). But if you don't, don't be
softbecause you might lose data. - If you use have workloads that use NFS and if NFS hangs, you can attempt to backup the VMs before you kill them (otherwise, with
hard, they may just hang in there)
Performance (NL-SAS vs. SSD)
For "cattle" workloads on NFS, you may be able to get away with NL-SAS, but don't expect IOPS figures anywhere close to SSD (let alone NFS/RDMA backed by NVMe/RoCE).
If you use NL-SAS, you need a bunch of disks, and then you get 100 IOPS per disk, so you'd need well north of 200 HDDs to get 20,000 in uncached writes (which we got with RAID 10 backed by 4 SSDs).
If you want to use NL-SAS assisted by SSDs, I'd recommend ZFS-based Linux NFS because ZFS makes it easier to take advantage of SSDs for caching. See the related PVE and ZFS posts on this blog or elsewhere.
You can get hybrid storage with all current E-Series models (E-Series 4000, EF-Series EF300, EF-Series EF600).
If you use hybrid (NL-SAS/SSD) setups with ZFS:
- Single digit TBs of SSDs with "Pet" workloads
- Tens of TBs in NL-SAS for NFS VMs and PBS
- Low single digit TB for ZFS (ZIL,ARC, etc.), sized as percentage of NL-SAS capacity, estimated "working set" size and workload
- Remember to correctly size CPU and RAM for these Linux/ZFS NFS servers as they need non-trivial amounts of RAM
For write-heavy NFS workloads, I'd rather create a small, NFS VM with XFS dedicated to SSD-only workloads, than use ZFS. But remember that "splitting" VM/CT disks across different data stores means you won't be able to get proper hardware snapshots this way. I would be surprised if Proxmox advocated for this even for host-side snapshots - it's just a bad idea. If you have workloads that need to span multiple disk types, you should probably fall back to application-side snapshots and avoid both PVE snapshots and hardware snapshots for live VMs (or groups (application clusters) of live VMs).
Conclusion
I'm positively surprised by how easy it was to setup NFS/RDMA:
- I used Mellanox ConnectX-6 drivers that came with OS (Rocky Linux NFS). For production I'd probably go with the official Mellanox stack, but I wanted to see if the most basic approach works (it does)
- it took me 10 minutes to set up NFS server (with no fancy features, tuning or integration, considering PVE would be my only clients)
- the NFS client used system defaults as well, picked version 4.2 on its own. The only thing I had to do was "
-o rdma", as otherwise it would have used NFS/TCP (which would have worked fine, but slightly slower)
Secondly, NFS/RDMA tests showed that for basic NFS use (NFS share for VMs and containers), there isn't much overhead to it. Due to RDMA in both NFS and IO to E-Series, as well as all data protection happening on E-Series, CPU utilization during tests was very low (barely single digit percents on a 32 vCPU host). If you collocate with PBS and use NFS/RDMA, you can likely use low-end uniprocessor servers for PBS and NFS/RDMA, as data comes in pre-compressed and NFS/RDMA doesn't need a lot of CPU power. For heavy workloads, size accordingly.
E-Series is block-only storage, but these tests with NFS show that, for simple use cases, NFS can be served with Linux VMs on low-end, single processor PVE or bare metal hosts. My Versity S3 gateway tests show that simple S3 storage can be provided the same way from VMs or Kubernetes containers.
If you use block (LVM) for heavy and "pet" workloads, and NFS VMs for "cattle", that can be "good enough" for up to hundreds of VMs and containers, freeing you from storage management and - importantly - from having to learn things you don't want to learn about. E-Series gives you fast and reliable block storage, the rest is PVE and Linux, both of which you already know.
Speaking of Ceph/RDS and CephFS - which may be appropriate for larger PVE environments - these can also be backed by E-Series block storage. If you're interested in that, check out the Ceph-on-E post which isn't super-detailed, but there isn't much to it (E-Series just needs to present one or more disks to each PVE host).
Appendix A: fio log
This is full log of my fio run with all parameter permutations mentioned in the post.
===== BS 4 == THRD 1 == QD 1 == MNT /mnt/r1_4096_128


test: (g=0): rw=write, bs=(R) 4096B-4096B, (W) 4096B-4096B, (T) 4096B-4096B, ioengine=libaio, iodepth=1
fio-3.36
Starting 1 process
Jobs: 1 (f=1): [W(1)][100.0%][w=8544KiB/s][w=2136 IOPS][eta 00m:00s]
test: (groupid=0, jobs=1): err= 0: pid=1632038: Tue Mar 10 09:56:14 2026
  write: IOPS=2091, BW=8364KiB/s (8565kB/s)(245MiB/30010msec); 0 zone resets
   bw (  KiB/s): min= 7832, max= 8696, per=100.00%, avg=8368.54, stdev=183.31, samples=59
   iops        : min= 1958, max= 2174, avg=2092.14, stdev=45.83, samples=59
  cpu          : usr=2.34%, sys=4.96%, ctx=62753, majf=0, minf=31
  IO depths    : 1=200.0%, 2=0.0%, 4=0.0%, 8=0.0%, 16=0.0%, 32=0.0%, >=64=0.0%
     submit    : 0=0.0%, 4=100.0%, 8=0.0%, 16=0.0%, 32=0.0%, 64=0.0%, >=64=0.0%
     complete  : 0=0.0%, 4=100.0%, 8=0.0%, 16=0.0%, 32=0.0%, 64=0.0%, >=64=0.0%
     issued rwts: total=0,62751,0,0 short=62751,0,0,0 dropped=0,0,0,0
     latency   : target=0, window=0, percentile=100.00%, depth=1

Run status group 0 (all jobs):
  WRITE: bw=8364KiB/s (8565kB/s), 8364KiB/s-8364KiB/s (8565kB/s-8565kB/s), io=245MiB (257MB), run=30010-30010msec


===== BS 4 == THRD 1 == QD 2 == MNT /mnt/r1_4096_128


test: (g=0): rw=write, bs=(R) 4096B-4096B, (W) 4096B-4096B, (T) 4096B-4096B, ioengine=libaio, iodepth=2
fio-3.36
Starting 1 process
Jobs: 1 (f=1): [W(1)][100.0%][w=13.8MiB/s][w=3535 IOPS][eta 00m:00s]
test: (groupid=0, jobs=1): err= 0: pid=1643831: Tue Mar 10 09:57:14 2026
  write: IOPS=3644, BW=14.2MiB/s (14.9MB/s)(427MiB/30008msec); 0 zone resets
   bw (  KiB/s): min=13960, max=15304, per=100.00%, avg=14595.25, stdev=316.12, samples=59
   iops        : min= 3490, max= 3826, avg=3648.81, stdev=79.03, samples=59
  cpu          : usr=3.58%, sys=7.48%, ctx=77395, majf=0, minf=31
  IO depths    : 1=0.1%, 2=200.0%, 4=0.0%, 8=0.0%, 16=0.0%, 32=0.0%, >=64=0.0%
     submit    : 0=0.0%, 4=100.0%, 8=0.0%, 16=0.0%, 32=0.0%, 64=0.0%, >=64=0.0%
     complete  : 0=0.0%, 4=100.0%, 8=0.0%, 16=0.0%, 32=0.0%, 64=0.0%, >=64=0.0%
     issued rwts: total=0,109375,0,0 short=109375,0,0,0 dropped=0,0,0,0
     latency   : target=0, window=0, percentile=100.00%, depth=2

Run status group 0 (all jobs):
  WRITE: bw=14.2MiB/s (14.9MB/s), 14.2MiB/s-14.2MiB/s (14.9MB/s-14.9MB/s), io=427MiB (448MB), run=30008-30008msec


===== BS 4 == THRD 1 == QD 4 == MNT /mnt/r1_4096_128


test: (g=0): rw=write, bs=(R) 4096B-4096B, (W) 4096B-4096B, (T) 4096B-4096B, ioengine=libaio, iodepth=4
fio-3.36
Starting 1 process
Jobs: 1 (f=1): [W(1)][100.0%][w=19.4MiB/s][w=4969 IOPS][eta 00m:00s]
test: (groupid=0, jobs=1): err= 0: pid=1655690: Tue Mar 10 09:58:15 2026
  write: IOPS=4922, BW=19.2MiB/s (20.2MB/s)(577MiB/30003msec); 0 zone resets
   bw (  KiB/s): min=17224, max=19984, per=100.00%, avg=19701.86, stdev=416.87, samples=59
   iops        : min= 4306, max= 4996, avg=4925.46, stdev=104.23, samples=59
  cpu          : usr=5.28%, sys=10.05%, ctx=112617, majf=0, minf=45
  IO depths    : 1=0.1%, 2=0.1%, 4=200.0%, 8=0.0%, 16=0.0%, 32=0.0%, >=64=0.0%
     submit    : 0=0.0%, 4=100.0%, 8=0.0%, 16=0.0%, 32=0.0%, 64=0.0%, >=64=0.0%
     complete  : 0=0.0%, 4=100.0%, 8=0.0%, 16=0.0%, 32=0.0%, 64=0.0%, >=64=0.0%
     issued rwts: total=0,147680,0,0 short=147678,0,0,0 dropped=0,0,0,0
     latency   : target=0, window=0, percentile=100.00%, depth=4

Run status group 0 (all jobs):
  WRITE: bw=19.2MiB/s (20.2MB/s), 19.2MiB/s-19.2MiB/s (20.2MB/s-20.2MB/s), io=577MiB (605MB), run=30003-30003msec


===== BS 4 == THRD 2 == QD 1 == MNT /mnt/r1_4096_128


test: (g=0): rw=write, bs=(R) 4096B-4096B, (W) 4096B-4096B, (T) 4096B-4096B, ioengine=libaio, iodepth=1
...
fio-3.36
Starting 2 processes
test: Laying out IO file (1 file / 1024MiB)
Jobs: 2 (f=2): [W(2)][100.0%][w=14.2MiB/s][w=3630 IOPS][eta 00m:00s]
test: (groupid=0, jobs=2): err= 0: pid=1667681: Tue Mar 10 09:59:15 2026
  write: IOPS=3609, BW=14.1MiB/s (14.8MB/s)(423MiB/30015msec); 0 zone resets
   bw (  KiB/s): min=12032, max=15128, per=100.00%, avg=14448.54, stdev=258.88, samples=118
   iops        : min= 3008, max= 3782, avg=3612.14, stdev=64.72, samples=118
  cpu          : usr=2.19%, sys=4.77%, ctx=108357, majf=0, minf=62
  IO depths    : 1=200.0%, 2=0.0%, 4=0.0%, 8=0.0%, 16=0.0%, 32=0.0%, >=64=0.0%
     submit    : 0=0.0%, 4=100.0%, 8=0.0%, 16=0.0%, 32=0.0%, 64=0.0%, >=64=0.0%
     complete  : 0=0.0%, 4=100.0%, 8=0.0%, 16=0.0%, 32=0.0%, 64=0.0%, >=64=0.0%
     issued rwts: total=0,108350,0,0 short=108350,0,0,0 dropped=0,0,0,0
     latency   : target=0, window=0, percentile=100.00%, depth=1

Run status group 0 (all jobs):
  WRITE: bw=14.1MiB/s (14.8MB/s), 14.1MiB/s-14.1MiB/s (14.8MB/s-14.8MB/s), io=423MiB (444MB), run=30015-30015msec


===== BS 4 == THRD 2 == QD 2 == MNT /mnt/r1_4096_128


test: (g=0): rw=write, bs=(R) 4096B-4096B, (W) 4096B-4096B, (T) 4096B-4096B, ioengine=libaio, iodepth=2
...
fio-3.36
Starting 2 processes
Jobs: 2 (f=2): [W(2)][100.0%][w=23.7MiB/s][w=6059 IOPS][eta 00m:00s]
test: (groupid=0, jobs=2): err= 0: pid=1679400: Tue Mar 10 10:00:15 2026
  write: IOPS=6480, BW=25.3MiB/s (26.5MB/s)(759MiB/30002msec); 0 zone resets
   bw (  KiB/s): min=20568, max=29544, per=100.00%, avg=25962.17, stdev=1552.32, samples=118
   iops        : min= 5142, max= 7386, avg=6490.54, stdev=388.08, samples=118
  cpu          : usr=3.43%, sys=7.38%, ctx=153329, majf=0, minf=70
  IO depths    : 1=0.1%, 2=200.0%, 4=0.0%, 8=0.0%, 16=0.0%, 32=0.0%, >=64=0.0%
     submit    : 0=0.0%, 4=100.0%, 8=0.0%, 16=0.0%, 32=0.0%, 64=0.0%, >=64=0.0%
     complete  : 0=0.0%, 4=100.0%, 8=0.0%, 16=0.0%, 32=0.0%, 64=0.0%, >=64=0.0%
     issued rwts: total=0,194430,0,0 short=194430,0,0,0 dropped=0,0,0,0
     latency   : target=0, window=0, percentile=100.00%, depth=2

Run status group 0 (all jobs):
  WRITE: bw=25.3MiB/s (26.5MB/s), 25.3MiB/s-25.3MiB/s (26.5MB/s-26.5MB/s), io=759MiB (796MB), run=30002-30002msec


===== BS 4 == THRD 2 == QD 4 == MNT /mnt/r1_4096_128


test: (g=0): rw=write, bs=(R) 4096B-4096B, (W) 4096B-4096B, (T) 4096B-4096B, ioengine=libaio, iodepth=4
...
fio-3.36
Starting 2 processes
Jobs: 2 (f=2): [W(2)][100.0%][w=35.8MiB/s][w=9160 IOPS][eta 00m:00s]
test: (groupid=0, jobs=2): err= 0: pid=1691350: Tue Mar 10 10:01:16 2026
  write: IOPS=9581, BW=37.4MiB/s (39.2MB/s)(1123MiB/30006msec); 0 zone resets
   bw (  KiB/s): min=31888, max=40688, per=100.00%, avg=38386.03, stdev=1305.21, samples=118
   iops        : min= 7972, max=10172, avg=9596.51, stdev=326.30, samples=118
  cpu          : usr=5.43%, sys=10.44%, ctx=227418, majf=0, minf=75
  IO depths    : 1=0.1%, 2=0.1%, 4=200.0%, 8=0.0%, 16=0.0%, 32=0.0%, >=64=0.0%
     submit    : 0=0.0%, 4=100.0%, 8=0.0%, 16=0.0%, 32=0.0%, 64=0.0%, >=64=0.0%
     complete  : 0=0.0%, 4=100.0%, 8=0.0%, 16=0.0%, 32=0.0%, 64=0.0%, >=64=0.0%
     issued rwts: total=0,287488,0,0 short=287484,0,0,0 dropped=0,0,0,0
     latency   : target=0, window=0, percentile=100.00%, depth=4

Run status group 0 (all jobs):
  WRITE: bw=37.4MiB/s (39.2MB/s), 37.4MiB/s-37.4MiB/s (39.2MB/s-39.2MB/s), io=1123MiB (1178MB), run=30006-30006msec


===== BS 4 == THRD 4 == QD 1 == MNT /mnt/r1_4096_128


test: (g=0): rw=write, bs=(R) 4096B-4096B, (W) 4096B-4096B, (T) 4096B-4096B, ioengine=libaio, iodepth=1
...
fio-3.36
Starting 4 processes
test: Laying out IO file (1 file / 1024MiB)
test: Laying out IO file (1 file / 1024MiB)
Jobs: 4 (f=4): [W(4)][100.0%][w=26.2MiB/s][w=6711 IOPS][eta 00m:00s]
test: (groupid=0, jobs=4): err= 0: pid=1703197: Tue Mar 10 10:02:16 2026
  write: IOPS=6598, BW=25.8MiB/s (27.0MB/s)(774MiB/30015msec); 0 zone resets
   bw (  KiB/s): min=24656, max=27288, per=100.00%, avg=26409.36, stdev=128.49, samples=236
   iops        : min= 6164, max= 6822, avg=6602.31, stdev=32.11, samples=236
  cpu          : usr=2.24%, sys=4.60%, ctx=198074, majf=0, minf=83
  IO depths    : 1=200.0%, 2=0.0%, 4=0.0%, 8=0.0%, 16=0.0%, 32=0.0%, >=64=0.0%
     submit    : 0=0.0%, 4=100.0%, 8=0.0%, 16=0.0%, 32=0.0%, 64=0.0%, >=64=0.0%
     complete  : 0=0.0%, 4=100.0%, 8=0.0%, 16=0.0%, 32=0.0%, 64=0.0%, >=64=0.0%
     issued rwts: total=0,198044,0,0 short=198044,0,0,0 dropped=0,0,0,0
     latency   : target=0, window=0, percentile=100.00%, depth=1

Run status group 0 (all jobs):
  WRITE: bw=25.8MiB/s (27.0MB/s), 25.8MiB/s-25.8MiB/s (27.0MB/s-27.0MB/s), io=774MiB (811MB), run=30015-30015msec


===== BS 4 == THRD 4 == QD 2 == MNT /mnt/r1_4096_128


test: (g=0): rw=write, bs=(R) 4096B-4096B, (W) 4096B-4096B, (T) 4096B-4096B, ioengine=libaio, iodepth=2
...
fio-3.36
Starting 4 processes
Jobs: 4 (f=4): [W(4)][100.0%][w=44.3MiB/s][w=11.3k IOPS][eta 00m:00s]
test: (groupid=0, jobs=4): err= 0: pid=1715022: Tue Mar 10 10:03:17 2026
  write: IOPS=12.0k, BW=47.0MiB/s (49.2MB/s)(1409MiB/30012msec); 0 zone resets
   bw (  KiB/s): min=40664, max=54168, per=100.00%, avg=48170.71, stdev=1303.18, samples=236
   iops        : min=10166, max=13542, avg=12042.68, stdev=325.80, samples=236
  cpu          : usr=3.63%, sys=7.03%, ctx=281976, majf=0, minf=71
  IO depths    : 1=0.1%, 2=200.0%, 4=0.0%, 8=0.0%, 16=0.0%, 32=0.0%, >=64=0.0%
     submit    : 0=0.0%, 4=100.0%, 8=0.0%, 16=0.0%, 32=0.0%, 64=0.0%, >=64=0.0%
     complete  : 0=0.0%, 4=100.0%, 8=0.0%, 16=0.0%, 32=0.0%, 64=0.0%, >=64=0.0%
     issued rwts: total=0,360796,0,0 short=360796,0,0,0 dropped=0,0,0,0
     latency   : target=0, window=0, percentile=100.00%, depth=2

Run status group 0 (all jobs):
  WRITE: bw=47.0MiB/s (49.2MB/s), 47.0MiB/s-47.0MiB/s (49.2MB/s-49.2MB/s), io=1409MiB (1478MB), run=30012-30012msec


===== BS 4 == THRD 4 == QD 4 == MNT /mnt/r1_4096_128


test: (g=0): rw=write, bs=(R) 4096B-4096B, (W) 4096B-4096B, (T) 4096B-4096B, ioengine=libaio, iodepth=4
...
fio-3.36
Starting 4 processes
Jobs: 4 (f=4): [W(4)][100.0%][w=66.6MiB/s][w=17.1k IOPS][eta 00m:00s]
test: (groupid=0, jobs=4): err= 0: pid=1727004: Tue Mar 10 10:04:17 2026
  write: IOPS=18.1k, BW=70.7MiB/s (74.2MB/s)(2123MiB/30007msec); 0 zone resets
   bw (  KiB/s): min=57448, max=78176, per=100.00%, avg=72565.02, stdev=1546.34, samples=236
   iops        : min=14362, max=19544, avg=18141.25, stdev=386.59, samples=236
  cpu          : usr=5.48%, sys=10.59%, ctx=404556, majf=0, minf=179
  IO depths    : 1=0.1%, 2=0.1%, 4=200.0%, 8=0.0%, 16=0.0%, 32=0.0%, >=64=0.0%
     submit    : 0=0.0%, 4=100.0%, 8=0.0%, 16=0.0%, 32=0.0%, 64=0.0%, >=64=0.0%
     complete  : 0=0.0%, 4=100.0%, 8=0.0%, 16=0.0%, 32=0.0%, 64=0.0%, >=64=0.0%
     issued rwts: total=0,543424,0,0 short=543416,0,0,0 dropped=0,0,0,0
     latency   : target=0, window=0, percentile=100.00%, depth=4

Run status group 0 (all jobs):
  WRITE: bw=70.7MiB/s (74.2MB/s), 70.7MiB/s-70.7MiB/s (74.2MB/s-74.2MB/s), io=2123MiB (2226MB), run=30007-30007msec


===== BS 8 == THRD 1 == QD 1 == MNT /mnt/r1_4096_128


test: (g=0): rw=write, bs=(R) 8192B-8192B, (W) 8192B-8192B, (T) 8192B-8192B, ioengine=libaio, iodepth=1
fio-3.36
Starting 1 process
Jobs: 1 (f=1): [W(1)][100.0%][w=15.2MiB/s][w=1948 IOPS][eta 00m:00s]
test: (groupid=0, jobs=1): err= 0: pid=1739013: Tue Mar 10 10:05:18 2026
  write: IOPS=1973, BW=15.4MiB/s (16.2MB/s)(463MiB/30007msec); 0 zone resets
   bw (  KiB/s): min=14800, max=16448, per=100.00%, avg=15802.58, stdev=345.11, samples=59
   iops        : min= 1850, max= 2056, avg=1975.32, stdev=43.14, samples=59
  cpu          : usr=2.13%, sys=5.27%, ctx=59234, majf=0, minf=45
  IO depths    : 1=200.0%, 2=0.0%, 4=0.0%, 8=0.0%, 16=0.0%, 32=0.0%, >=64=0.0%
     submit    : 0=0.0%, 4=100.0%, 8=0.0%, 16=0.0%, 32=0.0%, 64=0.0%, >=64=0.0%
     complete  : 0=0.0%, 4=100.0%, 8=0.0%, 16=0.0%, 32=0.0%, 64=0.0%, >=64=0.0%
     issued rwts: total=0,59231,0,0 short=59231,0,0,0 dropped=0,0,0,0
     latency   : target=0, window=0, percentile=100.00%, depth=1

Run status group 0 (all jobs):
  WRITE: bw=15.4MiB/s (16.2MB/s), 15.4MiB/s-15.4MiB/s (16.2MB/s-16.2MB/s), io=463MiB (485MB), run=30007-30007msec


===== BS 8 == THRD 1 == QD 2 == MNT /mnt/r1_4096_128


test: (g=0): rw=write, bs=(R) 8192B-8192B, (W) 8192B-8192B, (T) 8192B-8192B, ioengine=libaio, iodepth=2
fio-3.36
Starting 1 process
Jobs: 1 (f=1): [W(1)][100.0%][w=26.5MiB/s][w=3394 IOPS][eta 00m:00s]
test: (groupid=0, jobs=1): err= 0: pid=1750761: Tue Mar 10 10:06:18 2026
  write: IOPS=3569, BW=27.9MiB/s (29.2MB/s)(837MiB/30006msec); 0 zone resets
   bw (  KiB/s): min=25984, max=29936, per=100.00%, avg=28634.85, stdev=724.91, samples=59
   iops        : min= 3248, max= 3742, avg=3579.32, stdev=90.59, samples=59
  cpu          : usr=3.56%, sys=7.82%, ctx=75326, majf=0, minf=11
  IO depths    : 1=0.1%, 2=200.0%, 4=0.0%, 8=0.0%, 16=0.0%, 32=0.0%, >=64=0.0%
     submit    : 0=0.0%, 4=100.0%, 8=0.0%, 16=0.0%, 32=0.0%, 64=0.0%, >=64=0.0%
     complete  : 0=0.0%, 4=100.0%, 8=0.0%, 16=0.0%, 32=0.0%, 64=0.0%, >=64=0.0%
     issued rwts: total=0,107103,0,0 short=107103,0,0,0 dropped=0,0,0,0
     latency   : target=0, window=0, percentile=100.00%, depth=2

Run status group 0 (all jobs):
  WRITE: bw=27.9MiB/s (29.2MB/s), 27.9MiB/s-27.9MiB/s (29.2MB/s-29.2MB/s), io=837MiB (877MB), run=30006-30006msec


===== BS 8 == THRD 1 == QD 4 == MNT /mnt/r1_4096_128


test: (g=0): rw=write, bs=(R) 8192B-8192B, (W) 8192B-8192B, (T) 8192B-8192B, ioengine=libaio, iodepth=4
fio-3.36
Starting 1 process
Jobs: 1 (f=1): [W(1)][100.0%][w=38.6MiB/s][w=4936 IOPS][eta 00m:00s]
test: (groupid=0, jobs=1): err= 0: pid=1762644: Tue Mar 10 10:07:18 2026
  write: IOPS=4917, BW=38.4MiB/s (40.3MB/s)(1153MiB/30007msec); 0 zone resets
   bw (  KiB/s): min=34832, max=39920, per=100.00%, avg=39358.37, stdev=845.88, samples=59
   iops        : min= 4354, max= 4990, avg=4919.80, stdev=105.73, samples=59
  cpu          : usr=5.07%, sys=10.72%, ctx=113579, majf=0, minf=37
  IO depths    : 1=0.1%, 2=0.1%, 4=200.0%, 8=0.0%, 16=0.0%, 32=0.0%, >=64=0.0%
     submit    : 0=0.0%, 4=100.0%, 8=0.0%, 16=0.0%, 32=0.0%, 64=0.0%, >=64=0.0%
     complete  : 0=0.0%, 4=100.0%, 8=0.0%, 16=0.0%, 32=0.0%, 64=0.0%, >=64=0.0%
     issued rwts: total=0,147552,0,0 short=147550,0,0,0 dropped=0,0,0,0
     latency   : target=0, window=0, percentile=100.00%, depth=4

Run status group 0 (all jobs):
  WRITE: bw=38.4MiB/s (40.3MB/s), 38.4MiB/s-38.4MiB/s (40.3MB/s-40.3MB/s), io=1153MiB (1209MB), run=30007-30007msec


===== BS 8 == THRD 2 == QD 1 == MNT /mnt/r1_4096_128


test: (g=0): rw=write, bs=(R) 8192B-8192B, (W) 8192B-8192B, (T) 8192B-8192B, ioengine=libaio, iodepth=1
...
fio-3.36
Starting 2 processes
Jobs: 2 (f=2): [W(2)][100.0%][w=30.5MiB/s][w=3910 IOPS][eta 00m:00s]
test: (groupid=0, jobs=2): err= 0: pid=1774642: Tue Mar 10 10:08:19 2026
  write: IOPS=3863, BW=30.2MiB/s (31.7MB/s)(906MiB/30015msec); 0 zone resets
   bw (  KiB/s): min=29104, max=31600, per=100.00%, avg=30923.93, stdev=249.88, samples=118
   iops        : min= 3638, max= 3950, avg=3865.49, stdev=31.24, samples=118
  cpu          : usr=2.29%, sys=5.12%, ctx=115971, majf=0, minf=27
  IO depths    : 1=200.0%, 2=0.0%, 4=0.0%, 8=0.0%, 16=0.0%, 32=0.0%, >=64=0.0%
     submit    : 0=0.0%, 4=100.0%, 8=0.0%, 16=0.0%, 32=0.0%, 64=0.0%, >=64=0.0%
     complete  : 0=0.0%, 4=100.0%, 8=0.0%, 16=0.0%, 32=0.0%, 64=0.0%, >=64=0.0%
     issued rwts: total=0,115966,0,0 short=115966,0,0,0 dropped=0,0,0,0
     latency   : target=0, window=0, percentile=100.00%, depth=1

Run status group 0 (all jobs):
  WRITE: bw=30.2MiB/s (31.7MB/s), 30.2MiB/s-30.2MiB/s (31.7MB/s-31.7MB/s), io=906MiB (950MB), run=30015-30015msec


===== BS 8 == THRD 2 == QD 2 == MNT /mnt/r1_4096_128


test: (g=0): rw=write, bs=(R) 8192B-8192B, (W) 8192B-8192B, (T) 8192B-8192B, ioengine=libaio, iodepth=2
...
fio-3.36
Starting 2 processes
Jobs: 2 (f=2): [W(2)][100.0%][w=46.5MiB/s][w=5950 IOPS][eta 00m:00s]
test: (groupid=0, jobs=2): err= 0: pid=1786444: Tue Mar 10 10:09:19 2026
  write: IOPS=6665, BW=52.1MiB/s (54.6MB/s)(1562MiB/30005msec); 0 zone resets
   bw (  KiB/s): min=39232, max=58352, per=100.00%, avg=53464.68, stdev=2943.36, samples=118
   iops        : min= 4904, max= 7294, avg=6683.08, stdev=367.92, samples=118
  cpu          : usr=3.77%, sys=7.49%, ctx=153321, majf=0, minf=62
  IO depths    : 1=0.1%, 2=200.0%, 4=0.0%, 8=0.0%, 16=0.0%, 32=0.0%, >=64=0.0%
     submit    : 0=0.0%, 4=100.0%, 8=0.0%, 16=0.0%, 32=0.0%, 64=0.0%, >=64=0.0%
     complete  : 0=0.0%, 4=100.0%, 8=0.0%, 16=0.0%, 32=0.0%, 64=0.0%, >=64=0.0%
     issued rwts: total=0,199998,0,0 short=199998,0,0,0 dropped=0,0,0,0
     latency   : target=0, window=0, percentile=100.00%, depth=2

Run status group 0 (all jobs):
  WRITE: bw=52.1MiB/s (54.6MB/s), 52.1MiB/s-52.1MiB/s (54.6MB/s-54.6MB/s), io=1562MiB (1638MB), run=30005-30005msec


===== BS 8 == THRD 2 == QD 4 == MNT /mnt/r1_4096_128


test: (g=0): rw=write, bs=(R) 8192B-8192B, (W) 8192B-8192B, (T) 8192B-8192B, ioengine=libaio, iodepth=4
...
fio-3.36
Starting 2 processes
Jobs: 2 (f=2): [W(2)][100.0%][w=78.2MiB/s][w=10.0k IOPS][eta 00m:00s]
test: (groupid=0, jobs=2): err= 0: pid=1798308: Tue Mar 10 10:10:20 2026
  write: IOPS=9743, BW=76.1MiB/s (79.8MB/s)(2284MiB/30007msec); 0 zone resets
   bw (  KiB/s): min=67824, max=81232, per=100.00%, avg=77982.10, stdev=2125.61, samples=118
   iops        : min= 8478, max=10154, avg=9747.69, stdev=265.69, samples=118
  cpu          : usr=5.31%, sys=11.24%, ctx=226720, majf=0, minf=59
  IO depths    : 1=0.1%, 2=0.1%, 4=200.0%, 8=0.0%, 16=0.0%, 32=0.0%, >=64=0.0%
     submit    : 0=0.0%, 4=100.0%, 8=0.0%, 16=0.0%, 32=0.0%, 64=0.0%, >=64=0.0%
     complete  : 0=0.0%, 4=100.0%, 8=0.0%, 16=0.0%, 32=0.0%, 64=0.0%, >=64=0.0%
     issued rwts: total=0,292384,0,0 short=292380,0,0,0 dropped=0,0,0,0
     latency   : target=0, window=0, percentile=100.00%, depth=4

Run status group 0 (all jobs):
  WRITE: bw=76.1MiB/s (79.8MB/s), 76.1MiB/s-76.1MiB/s (79.8MB/s-79.8MB/s), io=2284MiB (2395MB), run=30007-30007msec


===== BS 8 == THRD 4 == QD 1 == MNT /mnt/r1_4096_128


test: (g=0): rw=write, bs=(R) 8192B-8192B, (W) 8192B-8192B, (T) 8192B-8192B, ioengine=libaio, iodepth=1
...
fio-3.36
Starting 4 processes
Jobs: 4 (f=4): [W(4)][100.0%][w=57.5MiB/s][w=7366 IOPS][eta 00m:00s]
test: (groupid=0, jobs=4): err= 0: pid=1810296: Tue Mar 10 10:11:20 2026
  write: IOPS=7258, BW=56.7MiB/s (59.5MB/s)(1702MiB/30011msec); 0 zone resets
   bw (  KiB/s): min=56256, max=60016, per=100.00%, avg=58119.53, stdev=235.66, samples=236
   iops        : min= 7032, max= 7502, avg=7264.92, stdev=29.46, samples=236
  cpu          : usr=2.46%, sys=5.33%, ctx=217855, majf=0, minf=111
  IO depths    : 1=200.0%, 2=0.0%, 4=0.0%, 8=0.0%, 16=0.0%, 32=0.0%, >=64=0.0%
     submit    : 0=0.0%, 4=100.0%, 8=0.0%, 16=0.0%, 32=0.0%, 64=0.0%, >=64=0.0%
     complete  : 0=0.0%, 4=100.0%, 8=0.0%, 16=0.0%, 32=0.0%, 64=0.0%, >=64=0.0%
     issued rwts: total=0,217820,0,0 short=217820,0,0,0 dropped=0,0,0,0
     latency   : target=0, window=0, percentile=100.00%, depth=1

Run status group 0 (all jobs):
  WRITE: bw=56.7MiB/s (59.5MB/s), 56.7MiB/s-56.7MiB/s (59.5MB/s-59.5MB/s), io=1702MiB (1784MB), run=30011-30011msec


===== BS 8 == THRD 4 == QD 2 == MNT /mnt/r1_4096_128


test: (g=0): rw=write, bs=(R) 8192B-8192B, (W) 8192B-8192B, (T) 8192B-8192B, ioengine=libaio, iodepth=2
...
fio-3.36
Starting 4 processes
Jobs: 4 (f=4): [W(4)][100.0%][w=87.9MiB/s][w=11.3k IOPS][eta 00m:00s]
test: (groupid=0, jobs=4): err= 0: pid=1822087: Tue Mar 10 10:12:20 2026
  write: IOPS=12.4k, BW=96.8MiB/s (101MB/s)(2904MiB/30009msec); 0 zone resets
   bw (  KiB/s): min=75808, max=108112, per=100.00%, avg=99309.56, stdev=2685.59, samples=236
   iops        : min= 9476, max=13514, avg=12413.69, stdev=335.70, samples=236
  cpu          : usr=3.70%, sys=7.63%, ctx=283663, majf=0, minf=159
  IO depths    : 1=0.1%, 2=200.0%, 4=0.0%, 8=0.0%, 16=0.0%, 32=0.0%, >=64=0.0%
     submit    : 0=0.0%, 4=100.0%, 8=0.0%, 16=0.0%, 32=0.0%, 64=0.0%, >=64=0.0%
     complete  : 0=0.0%, 4=100.0%, 8=0.0%, 16=0.0%, 32=0.0%, 64=0.0%, >=64=0.0%
     issued rwts: total=0,371708,0,0 short=371708,0,0,0 dropped=0,0,0,0
     latency   : target=0, window=0, percentile=100.00%, depth=2

Run status group 0 (all jobs):
  WRITE: bw=96.8MiB/s (101MB/s), 96.8MiB/s-96.8MiB/s (101MB/s-101MB/s), io=2904MiB (3045MB), run=30009-30009msec


===== BS 8 == THRD 4 == QD 4 == MNT /mnt/r1_4096_128


test: (g=0): rw=write, bs=(R) 8192B-8192B, (W) 8192B-8192B, (T) 8192B-8192B, ioengine=libaio, iodepth=4
...
fio-3.36
Starting 4 processes
Jobs: 4 (f=4): [W(4)][100.0%][w=149MiB/s][w=19.0k IOPS][eta 00m:00s]
test: (groupid=0, jobs=4): err= 0: pid=1833988: Tue Mar 10 10:13:21 2026
  write: IOPS=18.4k, BW=144MiB/s (151MB/s)(4311MiB/30005msec); 0 zone resets
   bw (  KiB/s): min=126832, max=157520, per=100.00%, avg=147156.34, stdev=3073.01, samples=236
   iops        : min=15854, max=19690, avg=18394.54, stdev=384.13, samples=236
  cpu          : usr=5.47%, sys=11.33%, ctx=412240, majf=0, minf=52
  IO depths    : 1=0.1%, 2=0.1%, 4=200.0%, 8=0.0%, 16=0.0%, 32=0.0%, >=64=0.0%
     submit    : 0=0.0%, 4=100.0%, 8=0.0%, 16=0.0%, 32=0.0%, 64=0.0%, >=64=0.0%
     complete  : 0=0.0%, 4=100.0%, 8=0.0%, 16=0.0%, 32=0.0%, 64=0.0%, >=64=0.0%
     issued rwts: total=0,551776,0,0 short=551768,0,0,0 dropped=0,0,0,0
     latency   : target=0, window=0, percentile=100.00%, depth=4

Run status group 0 (all jobs):
  WRITE: bw=144MiB/s (151MB/s), 144MiB/s-144MiB/s (151MB/s-151MB/s), io=4311MiB (4520MB), run=30005-30005msec


===== BS 128 == THRD 1 == QD 1 == MNT /mnt/r1_4096_128


test: (g=0): rw=write, bs=(R) 128KiB-128KiB, (W) 128KiB-128KiB, (T) 128KiB-128KiB, ioengine=libaio, iodepth=1
fio-3.36
Starting 1 process
Jobs: 1 (f=1): [W(1)][100.0%][w=122MiB/s][w=975 IOPS][eta 00m:00s]
test: (groupid=0, jobs=1): err= 0: pid=1845983: Tue Mar 10 10:14:21 2026
  write: IOPS=961, BW=120MiB/s (126MB/s)(3608MiB/30013msec); 0 zone resets
   bw (  KiB/s): min=113920, max=128768, per=100.00%, avg=123214.39, stdev=3541.56, samples=59
   iops        : min=  890, max= 1006, avg=962.61, stdev=27.67, samples=59
  cpu          : usr=1.86%, sys=5.75%, ctx=28865, majf=0, minf=141
  IO depths    : 1=200.0%, 2=0.0%, 4=0.0%, 8=0.0%, 16=0.0%, 32=0.0%, >=64=0.0%
     submit    : 0=0.0%, 4=100.0%, 8=0.0%, 16=0.0%, 32=0.0%, 64=0.0%, >=64=0.0%
     complete  : 0=0.0%, 4=100.0%, 8=0.0%, 16=0.0%, 32=0.0%, 64=0.0%, >=64=0.0%
     issued rwts: total=0,28863,0,0 short=28863,0,0,0 dropped=0,0,0,0
     latency   : target=0, window=0, percentile=100.00%, depth=1

Run status group 0 (all jobs):
  WRITE: bw=120MiB/s (126MB/s), 120MiB/s-120MiB/s (126MB/s-126MB/s), io=3608MiB (3783MB), run=30013-30013msec


===== BS 128 == THRD 1 == QD 2 == MNT /mnt/r1_4096_128


test: (g=0): rw=write, bs=(R) 128KiB-128KiB, (W) 128KiB-128KiB, (T) 128KiB-128KiB, ioengine=libaio, iodepth=2
fio-3.36
Starting 1 process
Jobs: 1 (f=1): [W(1)][100.0%][w=210MiB/s][w=1677 IOPS][eta 00m:00s]
test: (groupid=0, jobs=1): err= 0: pid=1857756: Tue Mar 10 10:15:22 2026
  write: IOPS=1729, BW=216MiB/s (227MB/s)(6488MiB/30013msec); 0 zone resets
   bw (  KiB/s): min=197120, max=245760, per=100.00%, avg=221383.59, stdev=10810.59, samples=59
   iops        : min= 1540, max= 1920, avg=1729.56, stdev=84.46, samples=59
  cpu          : usr=2.79%, sys=9.56%, ctx=27668, majf=0, minf=93
  IO depths    : 1=0.1%, 2=200.0%, 4=0.0%, 8=0.0%, 16=0.0%, 32=0.0%, >=64=0.0%
     submit    : 0=0.0%, 4=100.0%, 8=0.0%, 16=0.0%, 32=0.0%, 64=0.0%, >=64=0.0%
     complete  : 0=0.0%, 4=100.0%, 8=0.0%, 16=0.0%, 32=0.0%, 64=0.0%, >=64=0.0%
     issued rwts: total=0,51903,0,0 short=51903,0,0,0 dropped=0,0,0,0
     latency   : target=0, window=0, percentile=100.00%, depth=2

Run status group 0 (all jobs):
  WRITE: bw=216MiB/s (227MB/s), 216MiB/s-216MiB/s (227MB/s-227MB/s), io=6488MiB (6803MB), run=30013-30013msec


===== BS 128 == THRD 1 == QD 4 == MNT /mnt/r1_4096_128


test: (g=0): rw=write, bs=(R) 128KiB-128KiB, (W) 128KiB-128KiB, (T) 128KiB-128KiB, ioengine=libaio, iodepth=4
fio-3.36
Starting 1 process
Jobs: 1 (f=1): [W(1)][100.0%][w=390MiB/s][w=3117 IOPS][eta 00m:00s]
test: (groupid=0, jobs=1): err= 0: pid=1869628: Tue Mar 10 10:16:22 2026
  write: IOPS=3075, BW=384MiB/s (403MB/s)(11.3GiB/30011msec); 0 zone resets
   bw (  KiB/s): min=337664, max=412416, per=100.00%, avg=393875.53, stdev=13678.74, samples=59
   iops        : min= 2638, max= 3222, avg=3077.15, stdev=106.87, samples=59
  cpu          : usr=4.14%, sys=15.84%, ctx=57523, majf=0, minf=571
  IO depths    : 1=0.1%, 2=0.1%, 4=200.0%, 8=0.0%, 16=0.0%, 32=0.0%, >=64=0.0%
     submit    : 0=0.0%, 4=100.0%, 8=0.0%, 16=0.0%, 32=0.0%, 64=0.0%, >=64=0.0%
     complete  : 0=0.0%, 4=100.0%, 8=0.0%, 16=0.0%, 32=0.0%, 64=0.0%, >=64=0.0%
     issued rwts: total=0,92288,0,0 short=92286,0,0,0 dropped=0,0,0,0
     latency   : target=0, window=0, percentile=100.00%, depth=4

Run status group 0 (all jobs):
  WRITE: bw=384MiB/s (403MB/s), 384MiB/s-384MiB/s (403MB/s-403MB/s), io=11.3GiB (12.1GB), run=30011-30011msec


===== BS 128 == THRD 2 == QD 1 == MNT /mnt/r1_4096_128


test: (g=0): rw=write, bs=(R) 128KiB-128KiB, (W) 128KiB-128KiB, (T) 128KiB-128KiB, ioengine=libaio, iodepth=1
...
fio-3.36
Starting 2 processes
Jobs: 2 (f=2): [W(2)][100.0%][w=220MiB/s][w=1757 IOPS][eta 00m:00s]
test: (groupid=0, jobs=2): err= 0: pid=1881619: Tue Mar 10 10:17:23 2026
  write: IOPS=1881, BW=235MiB/s (247MB/s)(7064MiB/30038msec); 0 zone resets
   bw (  KiB/s): min=193536, max=255232, per=100.00%, avg=241296.63, stdev=5775.08, samples=119
   iops        : min= 1512, max= 1994, avg=1885.13, stdev=45.12, samples=119
  cpu          : usr=1.82%, sys=5.82%, ctx=56515, majf=0, minf=96
  IO depths    : 1=200.0%, 2=0.0%, 4=0.0%, 8=0.0%, 16=0.0%, 32=0.0%, >=64=0.0%
     submit    : 0=0.0%, 4=100.0%, 8=0.0%, 16=0.0%, 32=0.0%, 64=0.0%, >=64=0.0%
     complete  : 0=0.0%, 4=100.0%, 8=0.0%, 16=0.0%, 32=0.0%, 64=0.0%, >=64=0.0%
     issued rwts: total=0,56510,0,0 short=56510,0,0,0 dropped=0,0,0,0
     latency   : target=0, window=0, percentile=100.00%, depth=1

Run status group 0 (all jobs):
  WRITE: bw=235MiB/s (247MB/s), 235MiB/s-235MiB/s (247MB/s-247MB/s), io=7064MiB (7407MB), run=30038-30038msec


===== BS 128 == THRD 2 == QD 2 == MNT /mnt/r1_4096_128


test: (g=0): rw=write, bs=(R) 128KiB-128KiB, (W) 128KiB-128KiB, (T) 128KiB-128KiB, ioengine=libaio, iodepth=2
...
fio-3.36
Starting 2 processes
Jobs: 2 (f=2): [W(2)][100.0%][w=419MiB/s][w=3349 IOPS][eta 00m:00s]
test: (groupid=0, jobs=2): err= 0: pid=1893332: Tue Mar 10 10:18:23 2026
  write: IOPS=3326, BW=416MiB/s (436MB/s)(12.2GiB/30012msec); 0 zone resets
   bw (  KiB/s): min=395008, max=452096, per=99.98%, avg=425701.97, stdev=6815.25, samples=118
   iops        : min= 3086, max= 3532, avg=3325.83, stdev=53.22, samples=118
  cpu          : usr=2.87%, sys=9.61%, ctx=54875, majf=0, minf=31
  IO depths    : 1=0.1%, 2=200.0%, 4=0.0%, 8=0.0%, 16=0.0%, 32=0.0%, >=64=0.0%
     submit    : 0=0.0%, 4=100.0%, 8=0.0%, 16=0.0%, 32=0.0%, 64=0.0%, >=64=0.0%
     complete  : 0=0.0%, 4=100.0%, 8=0.0%, 16=0.0%, 32=0.0%, 64=0.0%, >=64=0.0%
     issued rwts: total=0,99838,0,0 short=99838,0,0,0 dropped=0,0,0,0
     latency   : target=0, window=0, percentile=100.00%, depth=2

Run status group 0 (all jobs):
  WRITE: bw=416MiB/s (436MB/s), 416MiB/s-416MiB/s (436MB/s-436MB/s), io=12.2GiB (13.1GB), run=30012-30012msec


===== BS 128 == THRD 2 == QD 4 == MNT /mnt/r1_4096_128


test: (g=0): rw=write, bs=(R) 128KiB-128KiB, (W) 128KiB-128KiB, (T) 128KiB-128KiB, ioengine=libaio, iodepth=4
...
fio-3.36
Starting 2 processes
Jobs: 2 (f=2): [W(2)][100.0%][w=792MiB/s][w=6338 IOPS][eta 00m:00s]
test: (groupid=0, jobs=2): err= 0: pid=1905271: Tue Mar 10 10:19:23 2026
  write: IOPS=6264, BW=783MiB/s (821MB/s)(22.9GiB/30009msec); 0 zone resets
   bw (  KiB/s): min=684288, max=846080, per=100.00%, avg=802794.31, stdev=13966.46, samples=118
   iops        : min= 5346, max= 6610, avg=6271.83, stdev=109.11, samples=118
  cpu          : usr=4.62%, sys=17.26%, ctx=123622, majf=0, minf=165
  IO depths    : 1=0.1%, 2=0.1%, 4=200.0%, 8=0.0%, 16=0.0%, 32=0.0%, >=64=0.0%
     submit    : 0=0.0%, 4=100.0%, 8=0.0%, 16=0.0%, 32=0.0%, 64=0.0%, >=64=0.0%
     complete  : 0=0.0%, 4=100.0%, 8=0.0%, 16=0.0%, 32=0.0%, 64=0.0%, >=64=0.0%
     issued rwts: total=0,188000,0,0 short=187996,0,0,0 dropped=0,0,0,0
     latency   : target=0, window=0, percentile=100.00%, depth=4

Run status group 0 (all jobs):
  WRITE: bw=783MiB/s (821MB/s), 783MiB/s-783MiB/s (821MB/s-821MB/s), io=22.9GiB (24.6GB), run=30009-30009msec


===== BS 128 == THRD 4 == QD 1 == MNT /mnt/r1_4096_128


test: (g=0): rw=write, bs=(R) 128KiB-128KiB, (W) 128KiB-128KiB, (T) 128KiB-128KiB, ioengine=libaio, iodepth=1
...
fio-3.36
Starting 4 processes
Jobs: 4 (f=4): [W(4)][100.0%][w=447MiB/s][w=3572 IOPS][eta 00m:00s]
test: (groupid=0, jobs=4): err= 0: pid=1917288: Tue Mar 10 10:20:24 2026
  write: IOPS=3517, BW=440MiB/s (461MB/s)(12.9GiB/30028msec); 0 zone resets
   bw (  KiB/s): min=413696, max=488448, per=100.00%, avg=450701.52, stdev=4389.08, samples=237
   iops        : min= 3232, max= 3816, avg=3521.11, stdev=34.29, samples=237
  cpu          : usr=1.84%, sys=5.90%, ctx=105663, majf=0, minf=296
  IO depths    : 1=200.0%, 2=0.0%, 4=0.0%, 8=0.0%, 16=0.0%, 32=0.0%, >=64=0.0%
     submit    : 0=0.0%, 4=100.0%, 8=0.0%, 16=0.0%, 32=0.0%, 64=0.0%, >=64=0.0%
     complete  : 0=0.0%, 4=100.0%, 8=0.0%, 16=0.0%, 32=0.0%, 64=0.0%, >=64=0.0%
     issued rwts: total=0,105628,0,0 short=105628,0,0,0 dropped=0,0,0,0
     latency   : target=0, window=0, percentile=100.00%, depth=1

Run status group 0 (all jobs):
  WRITE: bw=440MiB/s (461MB/s), 440MiB/s-440MiB/s (461MB/s-461MB/s), io=12.9GiB (13.8GB), run=30028-30028msec


===== BS 128 == THRD 4 == QD 2 == MNT /mnt/r1_4096_128


test: (g=0): rw=write, bs=(R) 128KiB-128KiB, (W) 128KiB-128KiB, (T) 128KiB-128KiB, ioengine=libaio, iodepth=2
...
fio-3.36
Starting 4 processes
Jobs: 4 (f=4): [W(4)][100.0%][w=790MiB/s][w=6317 IOPS][eta 00m:00s]
test: (groupid=0, jobs=4): err= 0: pid=1929040: Tue Mar 10 10:21:24 2026
  write: IOPS=6367, BW=796MiB/s (835MB/s)(23.3GiB/30017msec); 0 zone resets
   bw (  KiB/s): min=695296, max=852992, per=100.00%, avg=815989.15, stdev=6326.25, samples=236
   iops        : min= 5432, max= 6664, avg=6374.95, stdev=49.41, samples=236
  cpu          : usr=2.70%, sys=9.84%, ctx=116517, majf=0, minf=44
  IO depths    : 1=0.1%, 2=200.0%, 4=0.0%, 8=0.0%, 16=0.0%, 32=0.0%, >=64=0.0%
     submit    : 0=0.0%, 4=100.0%, 8=0.0%, 16=0.0%, 32=0.0%, 64=0.0%, >=64=0.0%
     complete  : 0=0.0%, 4=100.0%, 8=0.0%, 16=0.0%, 32=0.0%, 64=0.0%, >=64=0.0%
     issued rwts: total=0,191132,0,0 short=191132,0,0,0 dropped=0,0,0,0
     latency   : target=0, window=0, percentile=100.00%, depth=2

Run status group 0 (all jobs):
  WRITE: bw=796MiB/s (835MB/s), 796MiB/s-796MiB/s (835MB/s-835MB/s), io=23.3GiB (25.1GB), run=30017-30017msec


===== BS 128 == THRD 4 == QD 4 == MNT /mnt/r1_4096_128


test: (g=0): rw=write, bs=(R) 128KiB-128KiB, (W) 128KiB-128KiB, (T) 128KiB-128KiB, ioengine=libaio, iodepth=4
...
fio-3.36
Starting 4 processes
Jobs: 4 (f=4): [W(4)][100.0%][w=1489MiB/s][w=11.9k IOPS][eta 00m:00s]
test: (groupid=0, jobs=4): err= 0: pid=1940982: Tue Mar 10 10:22:25 2026
  write: IOPS=11.9k, BW=1491MiB/s (1563MB/s)(43.7GiB/30011msec); 0 zone resets
   bw (  MiB/s): min= 1238, max= 1590, per=100.00%, avg=1492.53, stdev=18.23, samples=236
   iops        : min= 9904, max=12726, avg=11940.19, stdev=145.86, samples=236
  cpu          : usr=4.83%, sys=16.73%, ctx=234480, majf=0, minf=1146
  IO depths    : 1=0.1%, 2=0.1%, 4=200.0%, 8=0.0%, 16=0.0%, 32=0.0%, >=64=0.0%
     submit    : 0=0.0%, 4=100.0%, 8=0.0%, 16=0.0%, 32=0.0%, 64=0.0%, >=64=0.0%
     complete  : 0=0.0%, 4=100.0%, 8=0.0%, 16=0.0%, 32=0.0%, 64=0.0%, >=64=0.0%
     issued rwts: total=0,357920,0,0 short=357912,0,0,0 dropped=0,0,0,0
     latency   : target=0, window=0, percentile=100.00%, depth=4

Run status group 0 (all jobs):
  WRITE: bw=1491MiB/s (1563MB/s), 1491MiB/s-1491MiB/s (1563MB/s-1563MB/s), io=43.7GiB (46.9GB), run=30011-30011msec
Appendix B: backup and restore with PBS
Scenarios:
- Backup Ubuntu 26.04 LTS Snapshot 4 on NFS/RDMA share
- Perform an additional, incremental backup after update
- Run
sudo rm -rf /, shutdown and restore from backup
You may see E-Series performance charts for this period above.
The first backup copied only the new chunks that weren't found in existing Ubuntu VM (on NVMe/RoCE-backed LVM data store) - 32% of VM was unique, and backup finished in seconds.
INFO: starting new backup job: vzdump 103 --remove 0 --node h3 --storage pbs41 --notes-template '-diff-nfs' --notification-mode notification-system --mode snapshot
INFO: Starting Backup of VM 103 (qemu)
INFO: Backup started at 2026-03-11 03:51:30
INFO: status = running
INFO: VM Name: nfs-vm
INFO: include disk 'scsi0' 'nfs_rdma:103/vm-103-disk-0.qcow2' 8G
INFO: backup mode: snapshot
INFO: ionice priority: 7
INFO: creating Proxmox Backup Server archive 'vm/103/2026-03-11T08:51:30Z'
INFO: started backup task '68f74467-5ca9-402e-b37e-636455024850'
INFO: resuming VM again
INFO: scsi0: dirty-bitmap status: created new
INFO:  21% (1.7 GiB of 8.0 GiB) in 3s, read: 577.3 MiB/s, write: 106.7 MiB/s
INFO:  27% (2.2 GiB of 8.0 GiB) in 6s, read: 178.7 MiB/s, write: 94.7 MiB/s
INFO:  32% (2.6 GiB of 8.0 GiB) in 9s, read: 141.3 MiB/s, write: 110.7 MiB/s
INFO:  37% (3.0 GiB of 8.0 GiB) in 12s, read: 130.7 MiB/s, write: 116.0 MiB/s
INFO:  43% (3.5 GiB of 8.0 GiB) in 15s, read: 162.7 MiB/s, write: 129.3 MiB/s
INFO:  50% (4.0 GiB of 8.0 GiB) in 18s, read: 174.7 MiB/s, write: 156.0 MiB/s
INFO:  54% (4.4 GiB of 8.0 GiB) in 21s, read: 134.7 MiB/s, write: 130.7 MiB/s
INFO:  60% (4.8 GiB of 8.0 GiB) in 24s, read: 141.3 MiB/s, write: 130.7 MiB/s
INFO:  64% (5.1 GiB of 8.0 GiB) in 27s, read: 116.0 MiB/s, write: 113.3 MiB/s
INFO:  68% (5.5 GiB of 8.0 GiB) in 30s, read: 116.0 MiB/s, write: 114.7 MiB/s
INFO:  76% (6.1 GiB of 8.0 GiB) in 33s, read: 224.0 MiB/s, write: 136.0 MiB/s
INFO:  81% (6.5 GiB of 8.0 GiB) in 36s, read: 132.0 MiB/s, write: 132.0 MiB/s
INFO:  86% (6.9 GiB of 8.0 GiB) in 39s, read: 134.7 MiB/s, write: 126.7 MiB/s
INFO:  92% (7.4 GiB of 8.0 GiB) in 42s, read: 173.3 MiB/s, write: 136.0 MiB/s
INFO:  98% (7.9 GiB of 8.0 GiB) in 45s, read: 157.3 MiB/s, write: 102.7 MiB/s
INFO: 100% (8.0 GiB of 8.0 GiB) in 46s, read: 108.0 MiB/s, write: 16.0 MiB/s
INFO: backup is sparse: 1.92 GiB (24%) total zero data
INFO: backup was done incrementally, reused 2.61 GiB (32%)
INFO: transferred 8.00 GiB in 46 seconds (178.1 MiB/s)
INFO: adding notes to backup
INFO: Finished Backup of VM 103 (00:00:47)
INFO: Backup finished at 2026-03-11 03:52:17
INFO: Backup job finished successfully
INFO: notified via target `mail-to-root`
TASK OK
The second ("incremental") backup was even faster because we already had an even more "similar" backup from the first backup. As much as 97% of copying was avoided.
INFO: starting new backup job: vzdump 103 --remove 0 --node h3 --storage pbs41 --notes-template '' --notification-mode notification-system --mode snapshot
INFO: Starting Backup of VM 103 (qemu)
INFO: Backup started at 2026-03-11 03:58:09
INFO: status = running
INFO: VM Name: nfs-vm
INFO: include disk 'scsi0' 'nfs_rdma:103/vm-103-disk-0.qcow2' 8G
INFO: backup mode: snapshot
INFO: ionice priority: 7
INFO: creating Proxmox Backup Server archive 'vm/103/2026-03-11T08:58:09Z'
INFO: started backup task '0d527df5-eedc-4e47-a95b-bc50e81bab00'
INFO: resuming VM again
INFO: scsi0: dirty-bitmap status: created new
INFO:  26% (2.1 GiB of 8.0 GiB) in 3s, read: 726.7 MiB/s, write: 17.3 MiB/s
INFO:  37% (3.0 GiB of 8.0 GiB) in 6s, read: 285.3 MiB/s, write: 6.7 MiB/s
INFO:  47% (3.8 GiB of 8.0 GiB) in 9s, read: 285.3 MiB/s, write: 12.0 MiB/s
INFO:  58% (4.7 GiB of 8.0 GiB) in 12s, read: 298.7 MiB/s, write: 8.0 MiB/s
INFO:  69% (5.5 GiB of 8.0 GiB) in 15s, read: 294.7 MiB/s, write: 0 B/s
INFO:  82% (6.6 GiB of 8.0 GiB) in 18s, read: 374.7 MiB/s, write: 14.7 MiB/s
INFO:  94% (7.5 GiB of 8.0 GiB) in 21s, read: 309.3 MiB/s, write: 0 B/s
INFO: 100% (8.0 GiB of 8.0 GiB) in 23s, read: 234.0 MiB/s, write: 2.0 MiB/s
INFO: backup is sparse: 1.92 GiB (23%) total zero data
INFO: backup was done incrementally, reused 7.82 GiB (97%)
INFO: transferred 8.00 GiB in 23 seconds (356.2 MiB/s)
INFO: adding notes to backup
INFO: Finished Backup of VM 103 (00:00:24)
INFO: Backup finished at 2026-03-11 03:58:33
INFO: Backup job finished successfully
INFO: notified via target `mail-to-root`
TASK OK
The restore ran at 600 MB/s, allowing us to recover from VM failure in seconds. You can see the NFS/RDMA mount point appearing in restore target:
Formatting '/mnt/nfs_rdma/images/103/vm-103-disk-0.qcow2', fmt=qcow2 cluster_size=65536 extended_l2=off preallocation=falloc compression_type=zlib size=8589934592 lazy_refcounts=off refcount_bits=16
new volume ID is 'nfs_rdma:103/vm-103-disk-0.qcow2'
restore proxmox backup image: /usr/bin/pbs-restore --repository root@pam@A.B.C.D:backup_store vm/103/2026-03-11T08:51:30Z drive-scsi0.img.fidx /mnt/nfs_rdma/images/103/vm-103-disk-0.qcow2 --verbose --format qcow2 --skip-zero
connecting to repository 'root@pam@A.B.C.D:backup_store'
using up to 4 threads
open block backend for target '/mnt/nfs_rdma/images/103/vm-103-disk-0.qcow2'
starting to restore snapshot 'vm/103/2026-03-11T08:51:30Z'
download and verify backup index
fetching up to 16 chunks in parallel
progress 1% (read 88080384 bytes, zeroes = 100% (88080384 bytes), duration 0 sec)
progress 2% (read 171966464 bytes, zeroes = 70% (121634816 bytes), duration 0 sec)
progress 3% (read 260046848 bytes, zeroes = 46% (121634816 bytes), duration 0 sec)
progress 4% (read 343932928 bytes, zeroes = 35% (121634816 bytes), duration 0 sec)
progress 5% (read 432013312 bytes, zeroes = 33% (142606336 bytes), duration 1 sec)
progress 6% (read 515899392 bytes, zeroes = 43% (226492416 bytes), duration 1 sec)
progress 7% (read 603979776 bytes, zeroes = 52% (314572800 bytes), duration 1 sec)
progress 8% (read 687865856 bytes, zeroes = 57% (394264576 bytes), duration 1 sec)
progress 9% (read 775946240 bytes, zeroes = 58% (457179136 bytes), duration 1 sec)
progress 10% (read 859832320 bytes, zeroes = 62% (541065216 bytes), duration 1 sec)
progress 11% (read 947912704 bytes, zeroes = 65% (624951296 bytes), duration 1 sec)
progress 12% (read 1031798784 bytes, zeroes = 68% (708837376 bytes), duration 1 sec)
progress 13% (read 1119879168 bytes, zeroes = 71% (796917760 bytes), duration 1 sec)
progress 14% (read 1203765248 bytes, zeroes = 72% (868220928 bytes), duration 1 sec)
progress 15% (read 1291845632 bytes, zeroes = 74% (956301312 bytes), duration 1 sec)
progress 16% (read 1375731712 bytes, zeroes = 75% (1040187392 bytes), duration 1 sec)
progress 17% (read 1463812096 bytes, zeroes = 77% (1128267776 bytes), duration 1 sec)
progress 18% (read 1547698176 bytes, zeroes = 78% (1212153856 bytes), duration 1 sec)
progress 19% (read 1635778560 bytes, zeroes = 79% (1300234240 bytes), duration 1 sec)
progress 20% (read 1719664640 bytes, zeroes = 80% (1384120320 bytes), duration 1 sec)
progress 21% (read 1807745024 bytes, zeroes = 81% (1472200704 bytes), duration 1 sec)
progress 22% (read 1891631104 bytes, zeroes = 81% (1539309568 bytes), duration 1 sec)
progress 23% (read 1979711488 bytes, zeroes = 80% (1602224128 bytes), duration 1 sec)
progress 24% (read 2063597568 bytes, zeroes = 77% (1602224128 bytes), duration 1 sec)
progress 25% (read 2147483648 bytes, zeroes = 74% (1602224128 bytes), duration 1 sec)
progress 26% (read 2235564032 bytes, zeroes = 71% (1602224128 bytes), duration 1 sec)
progress 27% (read 2319450112 bytes, zeroes = 69% (1602224128 bytes), duration 1 sec)
progress 28% (read 2407530496 bytes, zeroes = 66% (1602224128 bytes), duration 2 sec)
progress 29% (read 2491416576 bytes, zeroes = 64% (1602224128 bytes), duration 2 sec)
progress 30% (read 2579496960 bytes, zeroes = 62% (1602224128 bytes), duration 2 sec)
progress 31% (read 2663383040 bytes, zeroes = 60% (1602224128 bytes), duration 2 sec)
progress 32% (read 2751463424 bytes, zeroes = 58% (1602224128 bytes), duration 2 sec)
progress 33% (read 2835349504 bytes, zeroes = 56% (1602224128 bytes), duration 2 sec)
progress 34% (read 2923429888 bytes, zeroes = 54% (1602224128 bytes), duration 3 sec)
progress 35% (read 3007315968 bytes, zeroes = 53% (1602224128 bytes), duration 3 sec)
progress 36% (read 3095396352 bytes, zeroes = 51% (1602224128 bytes), duration 3 sec)
progress 37% (read 3179282432 bytes, zeroes = 50% (1602224128 bytes), duration 3 sec)
progress 38% (read 3267362816 bytes, zeroes = 49% (1602224128 bytes), duration 3 sec)
progress 39% (read 3351248896 bytes, zeroes = 47% (1602224128 bytes), duration 4 sec)
progress 40% (read 3439329280 bytes, zeroes = 46% (1602224128 bytes), duration 4 sec)
progress 41% (read 3523215360 bytes, zeroes = 45% (1602224128 bytes), duration 4 sec)
progress 42% (read 3611295744 bytes, zeroes = 44% (1602224128 bytes), duration 4 sec)
progress 43% (read 3695181824 bytes, zeroes = 43% (1602224128 bytes), duration 5 sec)
progress 44% (read 3783262208 bytes, zeroes = 42% (1602224128 bytes), duration 5 sec)
progress 45% (read 3867148288 bytes, zeroes = 41% (1602224128 bytes), duration 5 sec)
progress 46% (read 3955228672 bytes, zeroes = 40% (1602224128 bytes), duration 5 sec)
progress 47% (read 4039114752 bytes, zeroes = 39% (1606418432 bytes), duration 6 sec)
progress 48% (read 4127195136 bytes, zeroes = 40% (1660944384 bytes), duration 6 sec)
progress 49% (read 4211081216 bytes, zeroes = 39% (1660944384 bytes), duration 6 sec)
progress 50% (read 4294967296 bytes, zeroes = 38% (1660944384 bytes), duration 6 sec)
progress 51% (read 4383047680 bytes, zeroes = 37% (1660944384 bytes), duration 6 sec)
progress 52% (read 4466933760 bytes, zeroes = 37% (1660944384 bytes), duration 6 sec)
progress 53% (read 4555014144 bytes, zeroes = 36% (1660944384 bytes), duration 6 sec)
progress 54% (read 4638900224 bytes, zeroes = 35% (1660944384 bytes), duration 6 sec)
progress 55% (read 4726980608 bytes, zeroes = 35% (1660944384 bytes), duration 7 sec)
progress 56% (read 4810866688 bytes, zeroes = 34% (1660944384 bytes), duration 7 sec)
progress 57% (read 4898947072 bytes, zeroes = 33% (1660944384 bytes), duration 7 sec)
progress 58% (read 4982833152 bytes, zeroes = 33% (1660944384 bytes), duration 7 sec)
progress 59% (read 5070913536 bytes, zeroes = 32% (1660944384 bytes), duration 7 sec)
progress 60% (read 5154799616 bytes, zeroes = 32% (1660944384 bytes), duration 7 sec)
progress 61% (read 5242880000 bytes, zeroes = 31% (1660944384 bytes), duration 7 sec)
progress 62% (read 5326766080 bytes, zeroes = 31% (1660944384 bytes), duration 8 sec)
progress 63% (read 5414846464 bytes, zeroes = 30% (1660944384 bytes), duration 8 sec)
progress 64% (read 5498732544 bytes, zeroes = 30% (1660944384 bytes), duration 8 sec)
progress 65% (read 5586812928 bytes, zeroes = 29% (1660944384 bytes), duration 8 sec)
progress 66% (read 5670699008 bytes, zeroes = 29% (1660944384 bytes), duration 8 sec)
progress 67% (read 5758779392 bytes, zeroes = 28% (1660944384 bytes), duration 8 sec)
progress 68% (read 5842665472 bytes, zeroes = 28% (1660944384 bytes), duration 8 sec)
progress 69% (read 5930745856 bytes, zeroes = 28% (1673527296 bytes), duration 9 sec)
progress 70% (read 6014631936 bytes, zeroes = 29% (1757413376 bytes), duration 9 sec)
progress 71% (read 6102712320 bytes, zeroes = 30% (1845493760 bytes), duration 9 sec)
progress 72% (read 6186598400 bytes, zeroes = 30% (1874853888 bytes), duration 9 sec)
progress 73% (read 6274678784 bytes, zeroes = 30% (1933574144 bytes), duration 9 sec)
progress 74% (read 6358564864 bytes, zeroes = 30% (1933574144 bytes), duration 9 sec)
progress 75% (read 6442450944 bytes, zeroes = 30% (1933574144 bytes), duration 9 sec)
progress 76% (read 6530531328 bytes, zeroes = 29% (1933574144 bytes), duration 9 sec)
progress 77% (read 6614417408 bytes, zeroes = 29% (1933574144 bytes), duration 9 sec)
progress 78% (read 6702497792 bytes, zeroes = 28% (1933574144 bytes), duration 9 sec)
progress 79% (read 6786383872 bytes, zeroes = 28% (1933574144 bytes), duration 10 sec)
progress 80% (read 6874464256 bytes, zeroes = 28% (1933574144 bytes), duration 10 sec)
progress 81% (read 6958350336 bytes, zeroes = 27% (1933574144 bytes), duration 10 sec)
progress 82% (read 7046430720 bytes, zeroes = 27% (1954545664 bytes), duration 10 sec)
progress 83% (read 7130316800 bytes, zeroes = 27% (1958739968 bytes), duration 10 sec)
progress 84% (read 7218397184 bytes, zeroes = 27% (1958739968 bytes), duration 10 sec)
progress 85% (read 7302283264 bytes, zeroes = 26% (1958739968 bytes), duration 11 sec)
progress 86% (read 7390363648 bytes, zeroes = 26% (1958739968 bytes), duration 11 sec)
progress 87% (read 7474249728 bytes, zeroes = 26% (1958739968 bytes), duration 11 sec)
progress 88% (read 7562330112 bytes, zeroes = 25% (1958739968 bytes), duration 11 sec)
progress 89% (read 7646216192 bytes, zeroes = 25% (1958739968 bytes), duration 11 sec)
progress 90% (read 7734296576 bytes, zeroes = 25% (1958739968 bytes), duration 11 sec)
progress 91% (read 7818182656 bytes, zeroes = 25% (1958739968 bytes), duration 12 sec)
progress 92% (read 7906263040 bytes, zeroes = 24% (1958739968 bytes), duration 12 sec)
progress 93% (read 7990149120 bytes, zeroes = 24% (1958739968 bytes), duration 12 sec)
progress 94% (read 8078229504 bytes, zeroes = 24% (1958739968 bytes), duration 12 sec)
progress 95% (read 8162115584 bytes, zeroes = 23% (1958739968 bytes), duration 12 sec)
progress 96% (read 8250195968 bytes, zeroes = 23% (1958739968 bytes), duration 13 sec)
progress 97% (read 8334082048 bytes, zeroes = 24% (2000683008 bytes), duration 13 sec)
progress 98% (read 8422162432 bytes, zeroes = 24% (2063597568 bytes), duration 13 sec)
progress 99% (read 8506048512 bytes, zeroes = 24% (2063597568 bytes), duration 13 sec)
progress 100% (read 8589934592 bytes, zeroes = 24% (2063597568 bytes), duration 13 sec)
restore image complete (bytes=8589934592, duration=13.44s, speed=609.74MB/s)
rescan volumes...
Execute autostart
TASK OK